Analys från DailyFX
Are You Watching This Major Warning Sign For S&P 500 Top?
Summary: The Australian Dollar (ticker: FXA) has tumbled despite record-highs in the SP 500 (ticker: SPY). Is the Aussie currency the canary in the coal mine, and does it point to a big SP pullback?
Strong bull markets in stocks have historically coincided with Australian Dollar(ticker: FXA)strength, and indeed the 2009 lows in the SP 500 (ticker: SPY) occurred almost exactly as the AUDUSD established a lasting bottom. Yet a critical divergence suggests a key SP top may be near.
Last week we highlighted the fact that the sharp divergence between AUDUSD and SP 500 could partly be explained by a sharp drop in Australian yields (ticker: AUD). But nothing moves in a vacuum—we can’t ignore the same factors that move yields should be the factors that move equity markets. Indeed, we argue that a bigger correction in bond markets (ticker: TLH) could be a major catalyst to spark a much larger US Dollar rally.
The question becomes simple: is the Australian Dollar the so-called “canary in the coal mine”? Or in simpler terms, does the Australian Dollar sell-off point to an imminent correction in stocks?
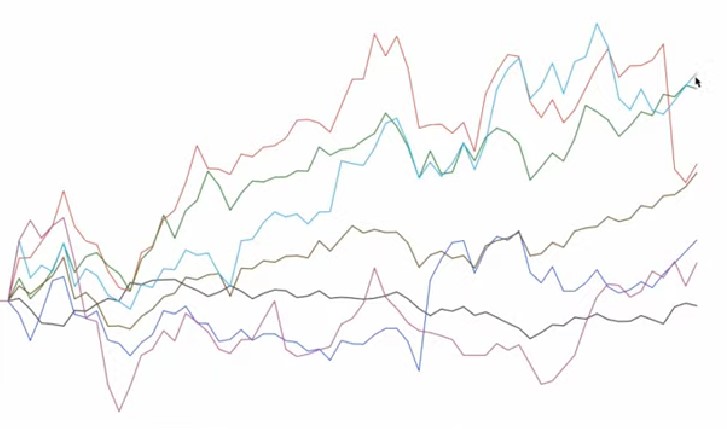
Australian Dollar Plotted Against Relative Moves in SP 500, Gold (ticker: GLD)

Data source: Bloomberg, Chart source: R
We’re big fans of Dow Theory here at DailyFX, a set of six basic rules derived by Charles Dow that date back nearly 120 years. One of the most important rules is “Stock market averages must confirm each other.” And though we’re talking about currencies and stocks, we feel it’s still relevant here. In fact, our Senior Technical Strategist pointed out a critical divergence between EURUSD (ticker: FXE) and USDCHF (ticker: FXF) that preceded the substantial EURUSD sell-off and USDCHF surge.
The fact that the SP 500 (and broader global equity indices) are hitting record-peaks as the Australian Dollar and commodity markets sell off sharply is a major warning sign. But it’s likewise clear that the only factor that really matters in trading is time.
We’re probably right in calling for a potentially significant SP 500 pullback, but the critical question is “When?” If it happens after the SP rallies another 100 big points, we won’t be in a great position to take advantage. Let’s see if trader sentiment can give us some clues. We’ll start with the Australian Dollar:
Retail Sentiment Favors Continued Australian Dollar Weakness

Data source: FXCM Execution Desk, Weekly Sentiment Table
It’s rare that we use such hyperbole in our research, but we recently wrote “Australian Dollar Direction Couldn’t Be Any More Clear” as the number of retail traders long AUDUSD recently hit record-highs. We use our proprietary Speculative Sentiment Index data as a contrarian signal to price action: if everyone’s long, we like to sell and vice versa. Such incredibly one-sided sentiment leaves us plainly in favor of continued Aussie Dollar declines. What about the SP?
Retail CFD Speculators Are Extremely Short SPX500

This one requires a bit of a leap of faith: retail CFD speculators are essentially their most short the SPX500 contract on record. But—and this is an important caveat—we’ve recently seen a noteworthy build in crowd buying. According to our sample of retail traders, the number of long orders has surged by nearly 60 percent in the past 30 days.
In the interests of full disclosure, we made the same observation in Thursday’s weekly SSI report and yet the SPX500 has moved to fresh highs. Yet we’ll once again defer to Dow Theory—there are three phases in market trends: accumulation, public participation, and distribution.
In plain English, a trend begins as traders “in the know” accumulate (buy) shares/currencies/whatever and push price higher. The second phase is when the public sees the trend and rushes to buy so as not to miss the “obvious” profit opportunity—Elliott Wave fans might call this a “Wave 5”. The third phase is simple enough: the market trend comes to a potentially violent end as everyone rushes for the exits.
Our proprietary retail speculative sentiment data warns that we might be in Phase 2 of this SP 500 move as the public finally shows itself willing to buy into record peaks. We’re speaking in terms of Dow Theory, but it could just as easily be explained in any terms you like—once the crowd gets involved we’re almost certainly closer to the top than the bottom.
Another few factoids worth considering: the SP 500 rally has been its most consistent since important March, 2012 peaks and other key market tops. All the while, a key break higher in Australian Dollar volatility prices suggests the AUDUSD may have considerably more room to fall.
Is the Australian Dollar the canary in the coal mine? Certainly SP 500 bulls might want to reconsider their portofolio weights given that typically-correlated markets such as the AUD or even Gold/Crude Oil/other commodities fail to hit similar peaks.
Forex Correlations SummaryView forex correlations to the SP 500, SP Volatility Index (ticker: VXX), Crude Oil (ticker: USO) Futures prices, US 2-Year Treasury Yields (ticker: SHY), and Spot Gold prices in the past 30 days:

Data source: Bloomberg. Chart source: R
SEE GUIDE ON READING THE ABOVE CHART
— Written by David Rodriguez, Quantitative Strategist for DailyFX.com
Receive future special reports on the Australian Dollar and other studies via this author’s e-mail distribution list with this link.
David specializes in automated trading strategies. Find out more about our automated sentiment-based strategies on DailyFX PLUS.Contact and follow David via Twitter: https://twitter.com/DRodriguezFX
https://www.dailyfx.com/forex/technical/ssi/aud-usd/2013/05/16/ssi_aud-usd.html
Analys från DailyFX
EURUSD Weekly Technical Analysis: New Month, More Weakness
What’s inside:
- EURUSD broke the ‘neckline’ of a bearish ‘head-and-shoulders’ pattern, April trend-line
- Resistance in vicinity of 11825/80 likely to keep a lid on further strength
- Targeting the low to mid-11600s with more selling
Confidence is essential to successful trading, see this new guide – ’Building Confidence in Trading’.
Coming into last week we pointed out the likelihood of finally seeing a resolution of the range EURUSD had been stuck in for the past few weeks, and one of the outcomes we made note of as a possibility was for the triggering of a ’head-and-shoulders’ pattern. Indeed, we saw a break of the ’neckline’ along with a drop below the April trend-line. This led to decent selling before a minor bounce took shape during the latter part of last week.
Looking ahead to next week the euro is set up for further losses as the path of least resistance has turned lower. Looking to a capper on any further strength there is resistance in the 11825-11880 area (old support becomes new resistance). As long as the euro stays below this area a downward bias will remain firmly intact.
Looking lower towards support eyes will be on the August low at 11662 and the 2016 high of 11616, of which the latter just happens to align almost precisely with the measured move target of the ‘head-and-shoulders’ pattern (determined by subtracting the height of the pattern from the neckline).
Bottom line: Shorts look set to have the upperhand as a fresh month gets underway as long as the euro remains capped by resistance. On weakness, we’ll be watching how the euro responds to a drop into support levels.
For a longer-term outlook on EURUSD, check out the just released Q4 Forecast.
EURUSD: Daily
—Written by Paul Robinson, Market Analyst
You can receive Paul’s analysis directly via email bysigning up here.
You can follow Paul on Twitter at@PaulRobinonFX.
Analys från DailyFX
Euro Bias Mixed Heading into October, Q4’17

Why and how do we use IG Client Sentiment in trading? See our guide and real-time data.
EURUSD: Retail trader data shows 37.3% of traders are net-long with the ratio of traders short to long at 1.68 to 1. In fact, traders have remained net-short since Apr 18 when EURUSD traded near 1.07831; price has moved 9.6% higher since then. The number of traders net-long is 15.4% lower than yesterday and 16.4% higher from last week, while the number of traders net-short is 0.4% higher than yesterday and 10.5% lower from last week.
We typically take a contrarian view to crowd sentiment, and the fact traders are net-short suggests EURUSD prices may continue to rise. Positioning is more net-short than yesterday but less net-short from last week. The combination of current sentiment and recent changes gives us a further mixed EURUSD trading bias.
— Written by Christopher Vecchio, CFA, Senior Currency Strategist
To contact Christopher Vecchio, e-mail cvecchio@dailyfx.com
Follow him on Twitter at @CVecchioFX
To be added to Christopher’s e-mail distribution list, please fill out this form
Analys från DailyFX
British Pound Reversal Potential Persists Heading into New Quarter

Why and how do we use IG Client Sentiment in trading? See our guide and real-time data.
GBPUSD: Retail trader data shows 38.2% of traders are net-long with the ratio of traders short to long at 1.62 to 1. In fact, traders have remained net-short since Sep 05 when GBPUSD traded near 1.29615; price has moved 3.4% higher since then. The number of traders net-long is 0.1% higher than yesterday and 13.4% higher from last week, while the number of traders net-short is 10.6% lower than yesterday and 18.3% lower from last week.
We typically take a contrarian view to crowd sentiment, and the fact traders are net-short suggests GBPUSD prices may continue to rise. Yet traders are less net-short than yesterday and compared with last week. Recent changes in sentiment warn that the current GBPUSD price trend may soon reverse lower despite the fact traders remain net-short.
— Written by Christopher Vecchio, CFA, Senior Currency Strategist
To contact Christopher Vecchio, e-mail cvecchio@dailyfx.com
Follow him on Twitter at @CVecchioFX
To be added to Christopher’s e-mail distribution list, please fill out this form
-
Analys från DailyFX8 år ago
EUR/USD Flirts with Monthly Close Under 30 Year Trendline
-

 Marknadsnyheter1 år ago
Upptäck de bästa verktygen för att analysera Bitcoin!
-
Marknadsnyheter4 år ago
BrainCool AB (publ): erhåller bidrag (grant) om 0,9 MSEK från Vinnova för bolagets projekt inom behandling av covid-19 patienter med hög feber
-
Analys från DailyFX11 år ago
Japanese Yen Breakout or Fakeout? ZAR/JPY May Provide the Answer
-
Analys från DailyFX11 år ago
Price & Time: Key Levels to Watch in the Aftermath of NFP
-
Analys från DailyFX7 år ago
Gold Prices Falter at Resistance: Is the Bullish Run Finished?
-

 Nyheter5 år ago
Teknisk analys med Martin Hallström och Nils Brobacke
-
Marknadsnyheter6 år ago
Tudorza reduces exacerbations and demonstrates cardiovascular safety in COPD patients


