
Analys från DailyFX
EUR/JPY Technical Analysis: Support Meets Prior Resistance
Talking Points:
– EUR/JPY Technical Strategy: Retracement in bullish trend finding support at prior resistance.
– The pair pulled back after running into a key Fibonacci level; but after finding support around an interesting zone yesterday, bulls have started to show-up again.
– Want to see how Euro and Yen have held up to our DailyFX Forecasts? Click here for full access.
To receive James Stanley’s Analysis directly via email, please sign up here.
In our last article, we looked at a megaphone setup in EUR/JPY as the pair’s range expanded near yearly highs. After a topside breakout, EUR/JPY traded up to another new high at 134.41. This is a key Fibonacci level, as 134.41 is the 61.8% retracement of the 2014-2016 major move in the pair, and this is helping to set near-term resistance.
EUR/JPY Daily: Near-Term Resistance at the 61.8% Retracement of the 2014-2017 Major Move
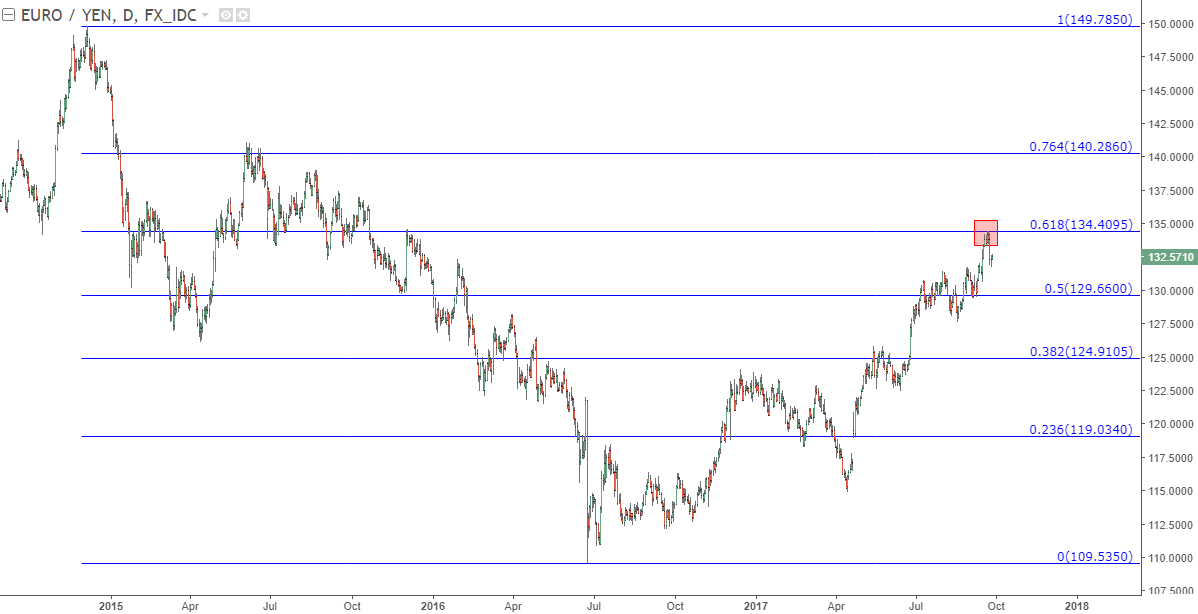
Chart prepared by James Stanley
That resistance came into play on Friday morning, and after grinding around this level for a few hours, sellers took over and drove prices lower. And that retracement continued with aggression until another support zone came into play. At 132.05 we have the 50% retracement of the 2008-2012 major move, and at 131.70 we have the prior swing-high point of resistance. Prices found support here yesterday morning, and since then we’ve seen a bullish response as prices have trickled higher.
EUR/JPY Four-Hour: Support begins to show at prior resistance, Fibonacci level
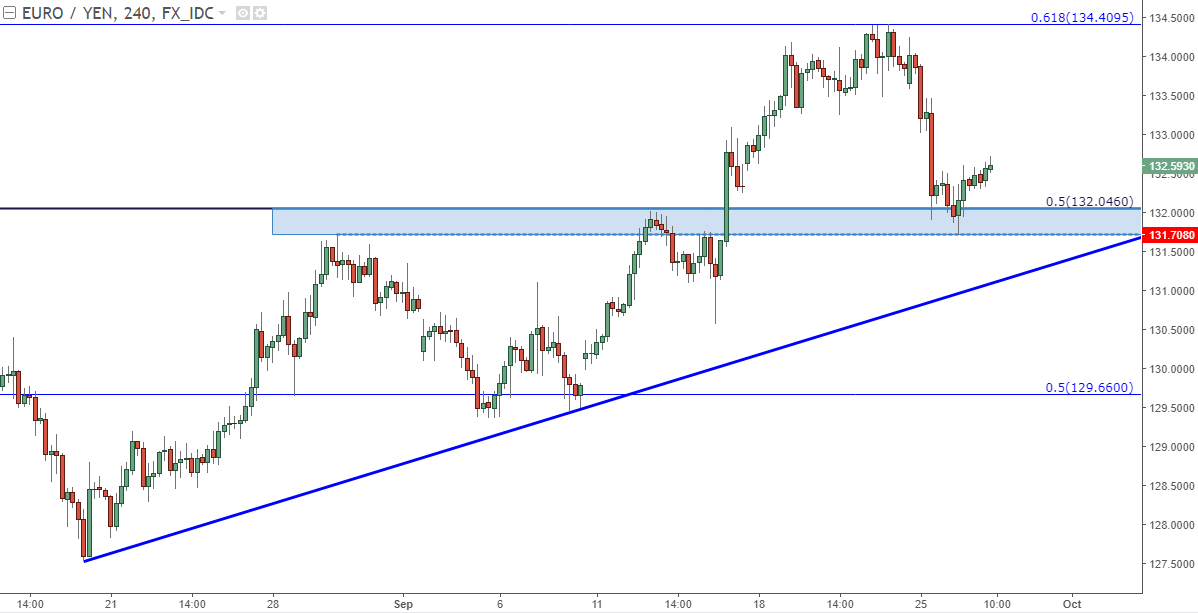
Chart prepared by James Stanley
Yesterday’s doji at support can open the door for topside plays. Traders can look to set stops below yesterday’s low, or, if looking for a more conservative stance with a wider stop and a smaller position size, stops can be cast below the previous swing-low of 130.62.
For traders that want to approach EUR/JPY in a more conservative manner, a potential morning star formation may be brewing after Monday’s big down-day is combined with yesterday’s doji. If today’s Daily Candle closes above 133.07, we’ll have a morning star formation; and this can be one of the more interesting bullish reversal formations available to traders. At that point, traders can trade the setup by setting stop below the low of the doji, and looking for that bullish theme to continue up towards prior resistance at 134.41.
EUR/JPY Daily: Doji at Support Zone, Potential Morning Star Formation
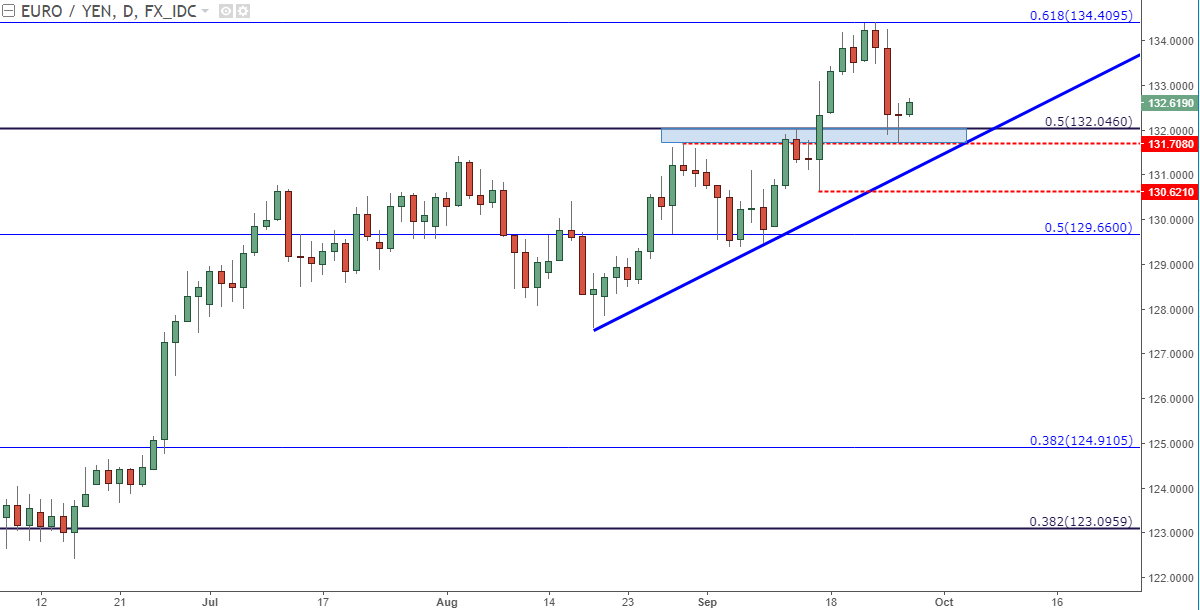
Chart prepared by James Stanley
— Written by James Stanley, Strategist for DailyFX.com
To receive James Stanley’s analysis directly via email, please SIGN UP HERE
Contact and follow James on Twitter: @JStanleyFX


What’s inside:
- EURUSD broke the ‘neckline’ of a bearish ‘head-and-shoulders’ pattern, April trend-line
- Resistance in vicinity of 11825/80 likely to keep a lid on further strength
- Targeting the low to mid-11600s with more selling
Confidence is essential to successful trading, see this new guide – ’Building Confidence in Trading’.
Coming into last week we pointed out the likelihood of finally seeing a resolution of the range EURUSD had been stuck in for the past few weeks, and one of the outcomes we made note of as a possibility was for the triggering of a ’head-and-shoulders’ pattern. Indeed, we saw a break of the ’neckline’ along with a drop below the April trend-line. This led to decent selling before a minor bounce took shape during the latter part of last week.
Looking ahead to next week the euro is set up for further losses as the path of least resistance has turned lower. Looking to a capper on any further strength there is resistance in the 11825-11880 area (old support becomes new resistance). As long as the euro stays below this area a downward bias will remain firmly intact.
Looking lower towards support eyes will be on the August low at 11662 and the 2016 high of 11616, of which the latter just happens to align almost precisely with the measured move target of the ‘head-and-shoulders’ pattern (determined by subtracting the height of the pattern from the neckline).
Bottom line: Shorts look set to have the upperhand as a fresh month gets underway as long as the euro remains capped by resistance. On weakness, we’ll be watching how the euro responds to a drop into support levels.
For a longer-term outlook on EURUSD, check out the just released Q4 Forecast.
EURUSD: Daily

—Written by Paul Robinson, Market Analyst
You can receive Paul’s analysis directly via email bysigning up here.
You can follow Paul on Twitter at@PaulRobinonFX.

Why and how do we use IG Client Sentiment in trading? See our guide and real-time data.
EURUSD: Retail trader data shows 37.3% of traders are net-long with the ratio of traders short to long at 1.68 to 1. In fact, traders have remained net-short since Apr 18 when EURUSD traded near 1.07831; price has moved 9.6% higher since then. The number of traders net-long is 15.4% lower than yesterday and 16.4% higher from last week, while the number of traders net-short is 0.4% higher than yesterday and 10.5% lower from last week.
We typically take a contrarian view to crowd sentiment, and the fact traders are net-short suggests EURUSD prices may continue to rise. Positioning is more net-short than yesterday but less net-short from last week. The combination of current sentiment and recent changes gives us a further mixed EURUSD trading bias.
— Written by Christopher Vecchio, CFA, Senior Currency Strategist
To contact Christopher Vecchio, e-mail cvecchio@dailyfx.com
Follow him on Twitter at @CVecchioFX
To be added to Christopher’s e-mail distribution list, please fill out this form

Why and how do we use IG Client Sentiment in trading? See our guide and real-time data.
GBPUSD: Retail trader data shows 38.2% of traders are net-long with the ratio of traders short to long at 1.62 to 1. In fact, traders have remained net-short since Sep 05 when GBPUSD traded near 1.29615; price has moved 3.4% higher since then. The number of traders net-long is 0.1% higher than yesterday and 13.4% higher from last week, while the number of traders net-short is 10.6% lower than yesterday and 18.3% lower from last week.
We typically take a contrarian view to crowd sentiment, and the fact traders are net-short suggests GBPUSD prices may continue to rise. Yet traders are less net-short than yesterday and compared with last week. Recent changes in sentiment warn that the current GBPUSD price trend may soon reverse lower despite the fact traders remain net-short.
— Written by Christopher Vecchio, CFA, Senior Currency Strategist
To contact Christopher Vecchio, e-mail cvecchio@dailyfx.com
Follow him on Twitter at @CVecchioFX
To be added to Christopher’s e-mail distribution list, please fill out this form
-
Analys från DailyFX8 år ago
EUR/USD Flirts with Monthly Close Under 30 Year Trendline
-

 Marknadsnyheter1 år ago
Upptäck de bästa verktygen för att analysera Bitcoin!
-
Marknadsnyheter4 år ago
BrainCool AB (publ): erhåller bidrag (grant) om 0,9 MSEK från Vinnova för bolagets projekt inom behandling av covid-19 patienter med hög feber
-
Analys från DailyFX11 år ago
Japanese Yen Breakout or Fakeout? ZAR/JPY May Provide the Answer
-
Analys från DailyFX11 år ago
Price & Time: Key Levels to Watch in the Aftermath of NFP
-
Analys från DailyFX7 år ago
Gold Prices Falter at Resistance: Is the Bullish Run Finished?
-
 Nyheter5 år ago
Teknisk analys med Martin Hallström och Nils Brobacke
-
Marknadsnyheter6 år ago
Tudorza reduces exacerbations and demonstrates cardiovascular safety in COPD patients