Talking Points:
- The ASX 200 has been stuck in a very narrow range for three months now
- It’s even narrower if you only take daily closes into account
- What’ll it take to break what’s arguably developed markets’ most obvious gridlock?
What makes a successful trader? We’ve examined over 40 million trades in the cause of finding out.
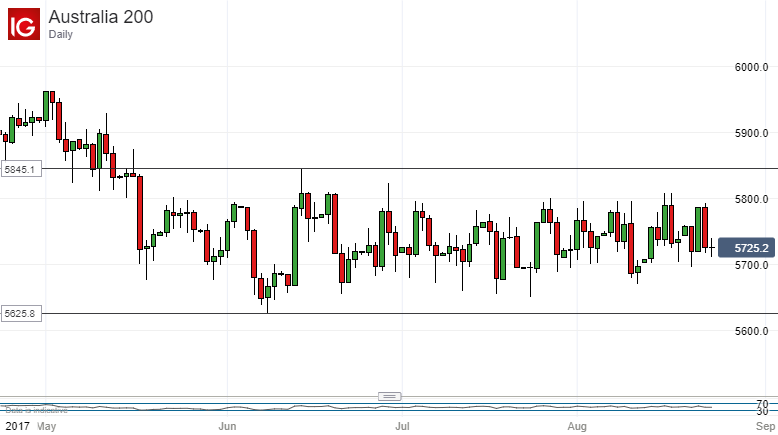
The ASX 200 daily chart is fascinating if a little bizarre.
Australia’s most visible equity benchmark has been effectively imprisoned since mid-May. On an intraday basis, the charts show us an index confined between June 8’s low of 5625.8 and June 8’s high of 5845.1.
That 219-point range is narrow enough, Lord knows, but what we might call the real action has been confined to a tighter band yet. Apart from a brief foray higher back in June, which now looks spurious, the tight, 145-point band shown below contains all the price action since May on a daily closing basis.
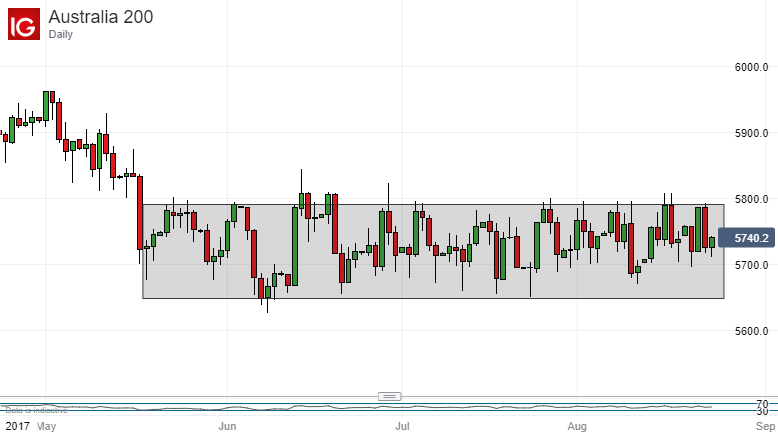
By way of contrast let’s look at the ASX 200’s US cousin, the SP 500. It has spent the Northern Hemisphere summer grinding grudgingly but appreciably higher. Certainly no such narrow band applies.

So, is the ASX 200 likely to come to life anytime soon and break its shackles either way? Well, for the moment it’s probably best to assume that it won’t. The index made another foray higher on Tuesday of this week, only to stall once again at the range highs and retrace its gains the following day. Incidentally that is exactly the pattern we saw the week before. What is it about Australian Tuesdays that gives bulls heart?
Some momentum indicators appear to be rising, but not further than they’ve been in the recent past when no range break was evident. Continuing to play this range seems to make sense. Those looking for larger rewards may be advised to wait for a break and then to analyse the nature of it. However, that could be a lengthy wait on current evidence.
— Written by David Cottle, DailyFX Research
Contact and follow David on Twitter:@DavidCottleFX