Talking Points:
– Gold technical strategy: Long-term mixed, Intermediate-term bearish, short-term bearish.
– IG Client Sentiment is currently showing 4.07 traders long for every one short, and given retail sentiment’s contrarian nature, this is bearish.
– If you’re looking for trading ideas, check out our Trading Guides. If you’re looking for shorter-term ideas, check out our IG Client Sentiment.
To receive James Stanley’s Analysis directly via email, please sign up here.
In our last article, we looked at the dramatic open to the week that was seen in Gold prices. After moving up to set a swing-high at $1,258 shortly after the open, the yellow metal caught a series of heavy offers as prices plunged all the way down to $1,236. The move was largely considered to be a ‘fat finger’ error, categorized as an erroneously large trade sold 1.8 million Gold contracts as somewhat of a mistake; but as we pointed out on Monday, this mistake happened right after a very positive German IFO survey was released, showing business sentiment at 47-year highs. That confidence has continued throughout the week as a series of Central Bankers have delivered some relatively hawkish commentary that’s created a rift through global bond markets.
This equates to more selling in Gold. While the U.S. Dollar drives down to fresh 10-month lows, Gold prices have been falling in tandem after setting a lower-high around $1,253, which is around the 4th resistance area that we looked at in that last article. After setting that swing-high, and facing five hours of resistance in that zone yesterday morning, prices had settled at another key area that we’ve been following, which is the 50% Fibonacci retracement at $1,248.98. But that support eventually gave way to the continued selling pressure in Gold with prices breaking-lower, giving the appearance that bearish continuation strategies will continue to be favored.
Gold Hourly Chart Highlighting Continuation of Bearish Price Action
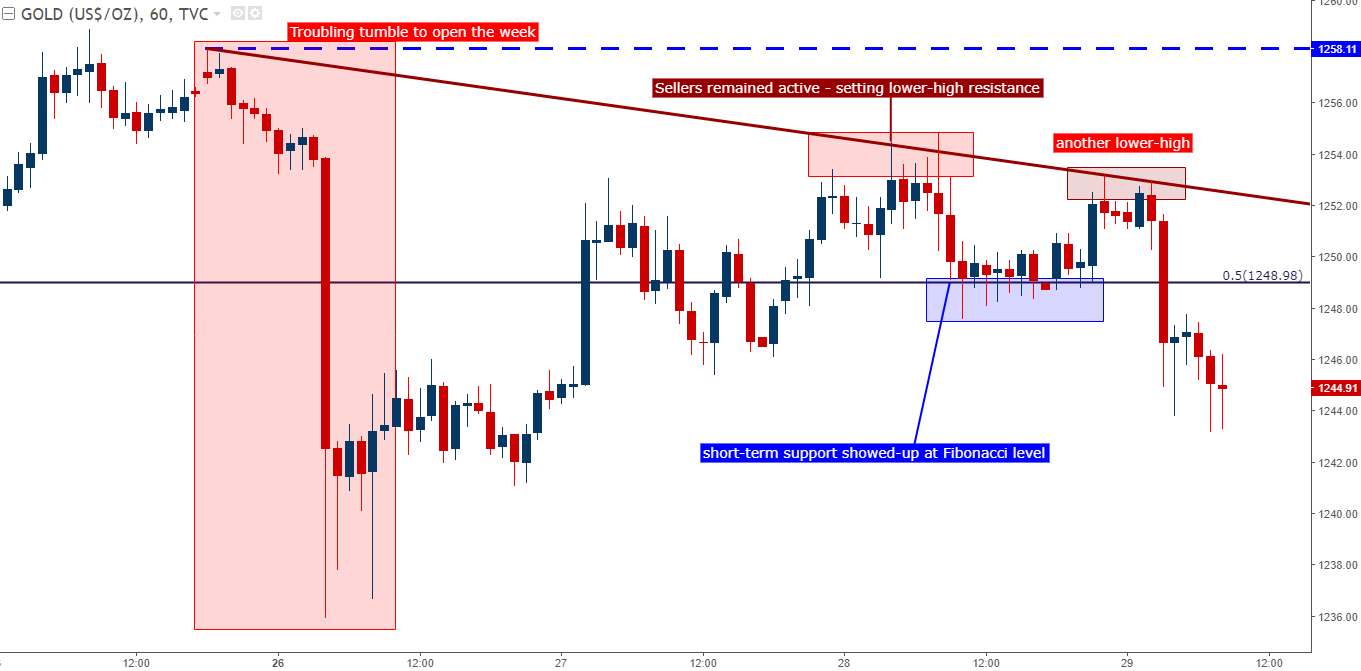
Chart prepared by James Stanley
This Fibonacci level at $1,248.98 is a key price for Gold, as this is the 50% marker of the most recent major move, taking the high from July of 2016 down to the December low. Notably, and perhaps coincidentally, the area around this level had also helped to set the swing-low around the Brexit referendum. But perhaps more importantly, this level has garnered a considerable amount of support and resistance after the move completed last year. Prices remaining below this longer-term level point to the prospect of continued losses in Gold prices.
Gold Daily Chart – Emphasis on 50% Fibonacci retracement of most recent major move
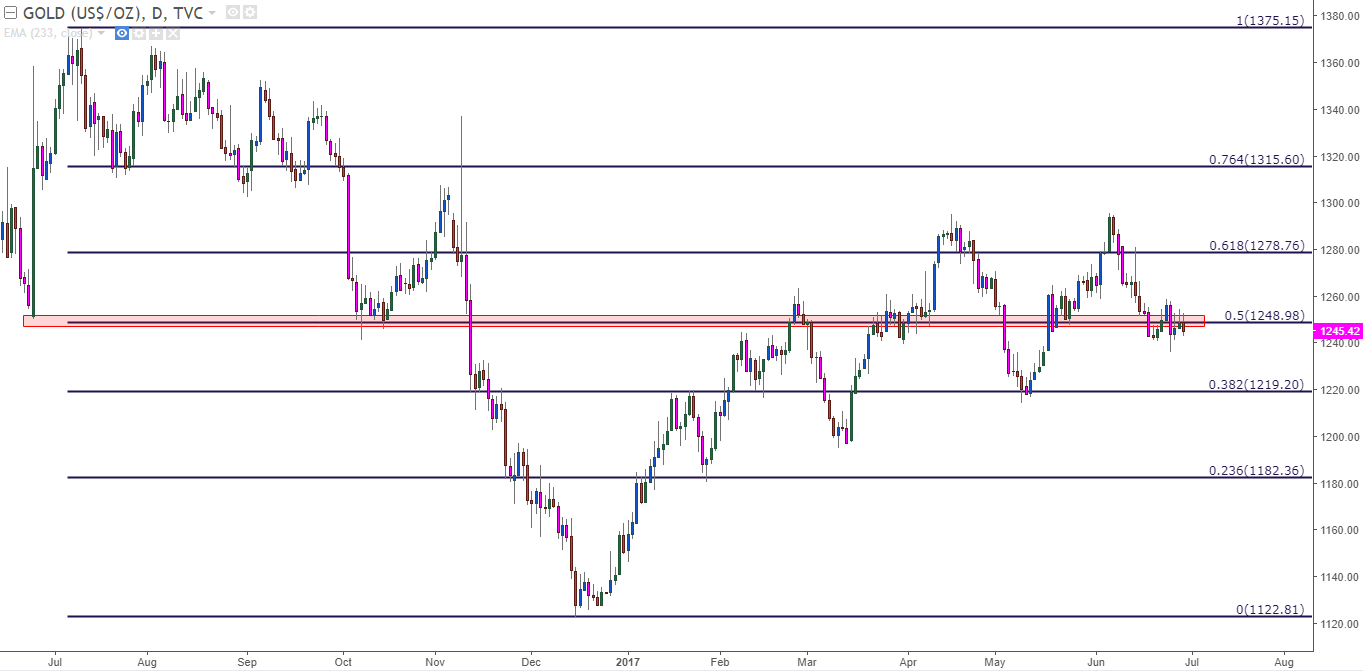
Chart prepared by James Stanley
For re-entry protocol, traders can look to play a continuation of lower-lows and highs, looking to catch ‘lower-high’ resistance below the prior series of swings around $1,254.89. On the chart below, we identify four different resistance levels that can be used to plot a bearish continuation strategy in Gold prices. For those that do not want to wait for resistance, or for those that are comfortable playing momentum-breakouts, the possibility also exists for downside breakout strategies, targeting prior swing-lows at $1,241 and $1,236, respectively.
Gold 30M chart with near-term support and resistance levels identified
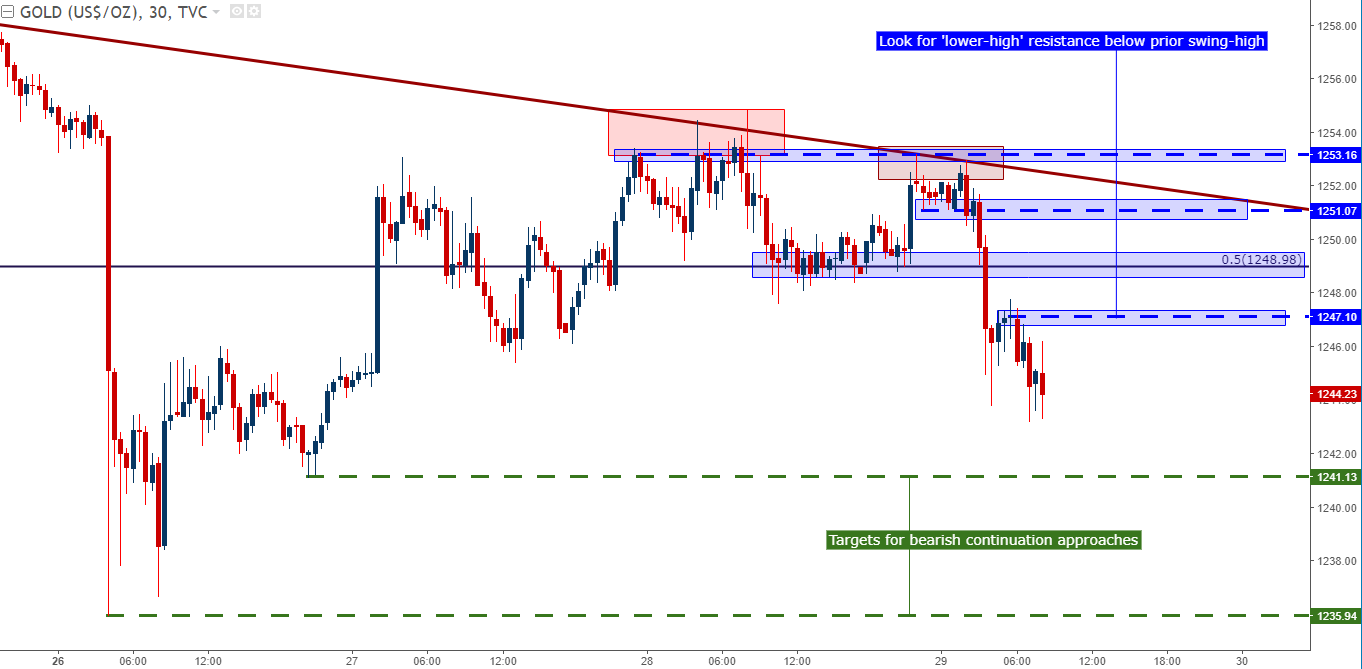
Chart prepared by James Stanley
— Written by James Stanley, Strategist for DailyFX.com
To receive James Stanley’s analysis directly via email, please SIGN UP HERE
Contact and follow James on Twitter: @JStanleyFX