Talking Points:
– Gold prices remained offered through most of this week after reversing at the 2016 resistance zone that runs from $1,350-$1,375.
– Short-term support has begun to show in a key Fibonacci zone, between the 76.4% and 78.6% retracements of last year’s July-December down-trend. But bulls haven’t yet been able to take-over, even with another North Korean missile test. Bulls may have to wait for a resumption of the two-month up-trend.
– Retail sentiment remains elevated in Gold, with IG Client Sentiment currently reading +2.3. Given retail sentiment’s traditional contrarian nature, this is bearish for Gold prices.
– Want to see how Gold prices have held up to our DailyFX forecasts? Click here for full access.
To receive James Stanley’s Analysis directly via email, please sign up here.
Gold prices have been on a fairly consistent run since early July after price action tested below the $1,205 level. Since then, we’ve seen a 12.7% advance as a series of factors have contributed to heightened demand. The most notable and obvious of these drivers is the situation brewing around North Korea. As the threat of thermonuclear conflict has increased, so has demand in Gold. This has driven Gold prices through a series of resistance levels and back towards the 2016 high at $1,375; but since trading over $1,350 last week, Gold has seen a dearth of demand and prices have begun falling in the first legitimate sell-off that we’ve seen in the yellow metal in more than two months.
Two-Month Rally in Gold Prices (blue) Drives to 2016 Resistance Zone $1,350-$1,375 (red)
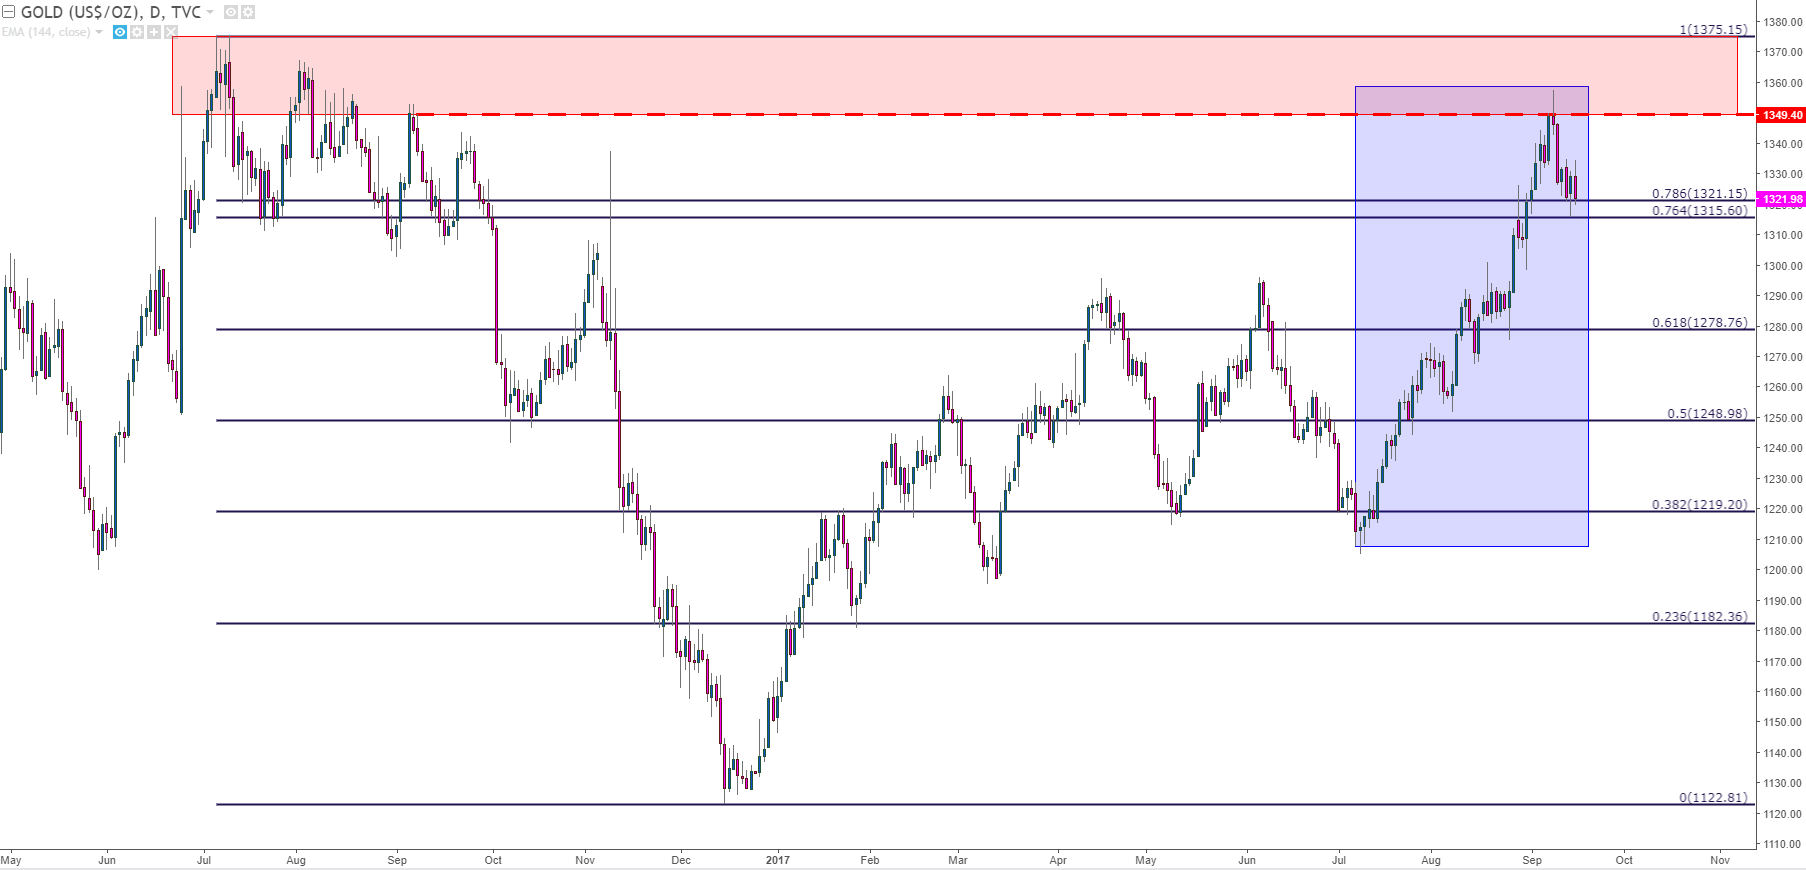
Chart prepared by James Stanley
After penetrating the zone of resistance that had developed last summer from $1,350-$1,375, short-term bearish price action has begun to show. Even with North Korea conducting another missile test and while the U.S. Dollar remained relatively bearish against most currencies, sellers controlled short-term price action in Gold, driving prices down to a key support zone.
If we take the major move of last year’s high down the December, pre-rate hike low; the 76.4% retracement comes in at $1,315.60 while the 78.6% retracement is at $1,321.15. This creates a zone that’s, at least so far, held the lows during this retracement. We’re looking at this zone in the below chart, demarcated in blue.
Gold Hourly: Higher-Low Support Holds Between 76.4 and 78.6% retracements
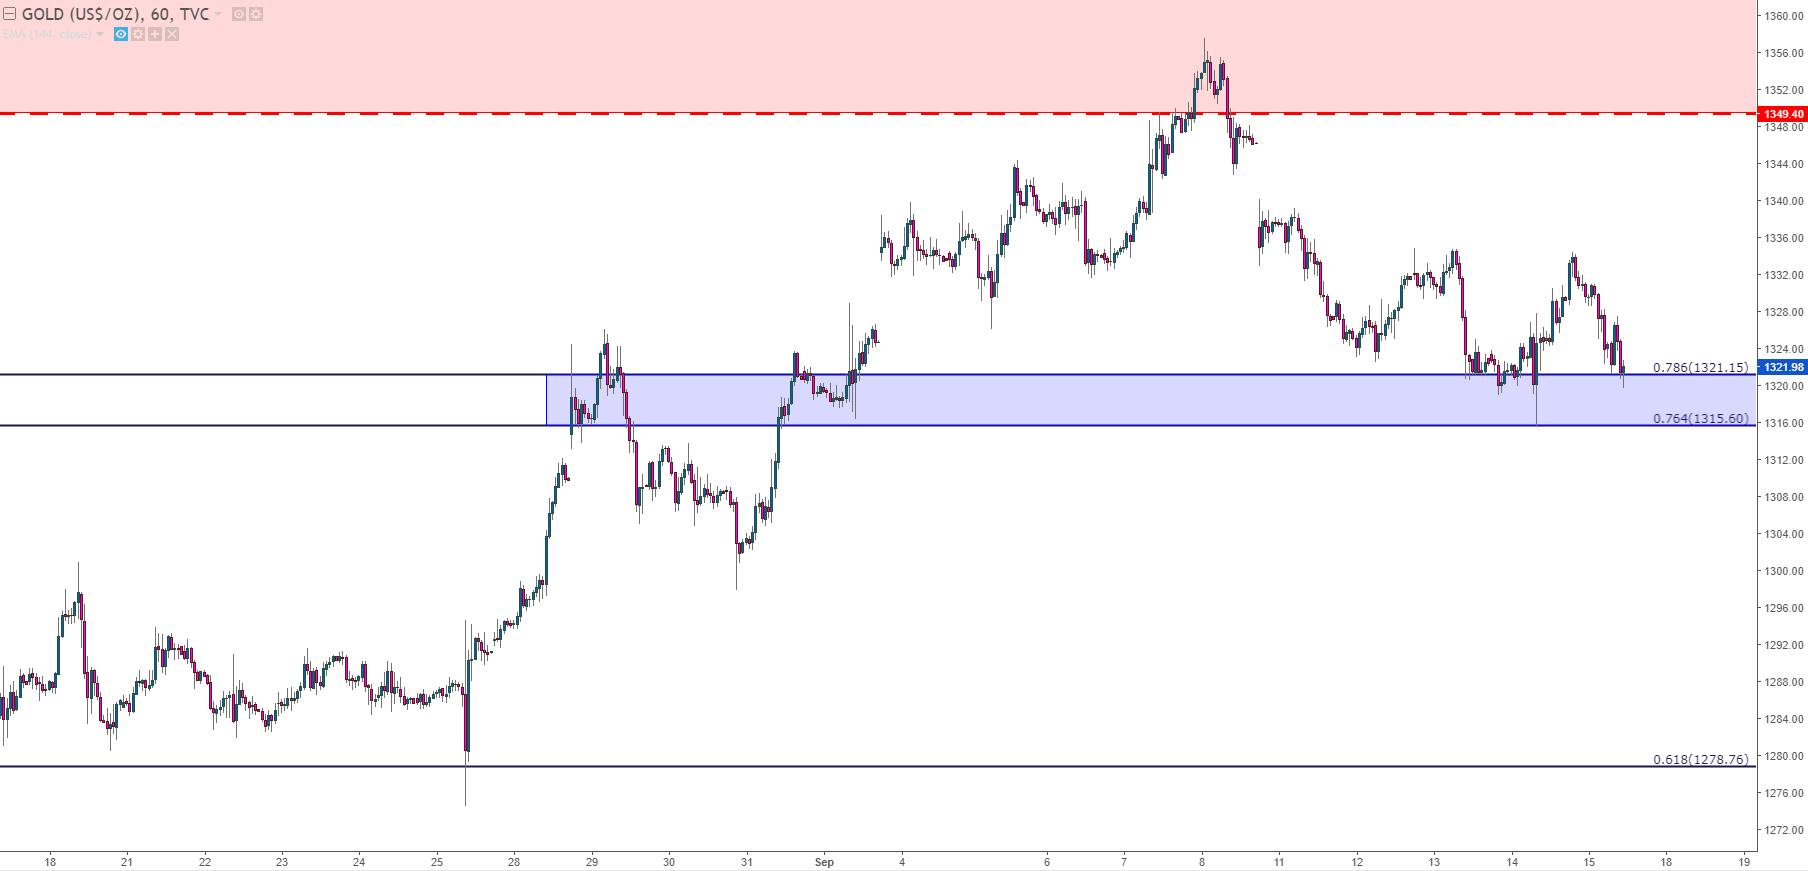
Chart prepared by James Stanley
The fact that Gold prices haven’t put in a more vigorous response to this support zone combined with the fact that bulls failed to take over after another North Korean missile flew over Japan, it would appear that more weakness is on the horizon for Gold prices. As the bullish run was heating up from early-July, sentiment had grown pretty aggressively on the long side of the trade. My colleague, Paul Robinson, discussed this earlier in the week in the article, ‘Rapid Case of Gold Buying Cause for Pause’, and given what we’ve seen in price action this week, it doesn’t appear as though bullish continuation is yet ready for take-off.
This can lead to a deeper retracement in Gold prices, and below we’re looking at three support zones of interest below the current area. This could be looked at as potential take-off points for the longer-term bullish theme, with the expectation that an eventual re-test of $1,375 will be in the cards; while these levels can also function as short-side targets for those looking to take on bearish exposure to Gold. If Gold prices slip below the $1,275 level, then the confluent zone around $1,250 becomes attractive for short-side profit targets.
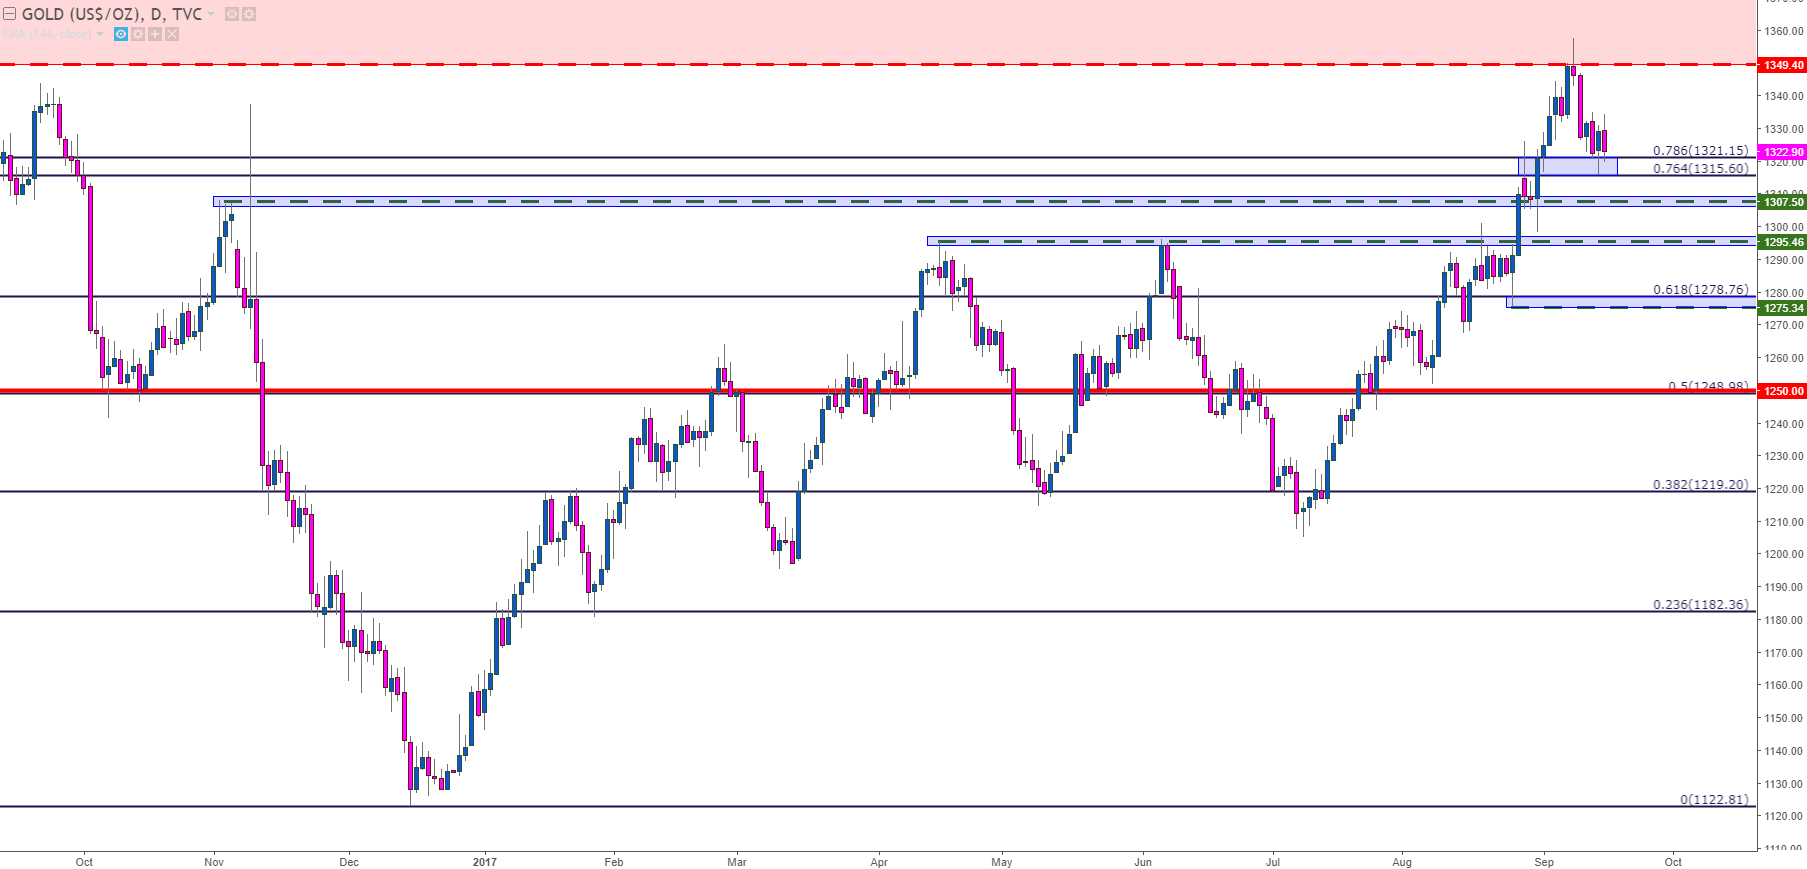
Chart prepared by James Stanley
— Written by James Stanley, Strategist for DailyFX.com
To receive James Stanley’s analysis directly via email, please SIGN UP HERE
Contact and follow James on Twitter: @JStanleyFX