Talking Points:
- The Australian benchmark has been stuck between a broken uptrend and quite strong support
- Now it looks as though something has to change
- The next couple of days could be well worth watching
Make sure your ASX trading strategy is up to the mark with thisDailyFX guide
A week may be a long time in some markets but the last seven days haven’t changed much in terms of the ASX 200’s technical picture.
My last look, a week back, found the index worryingly below an uptrend channel which had thereto lasted for all of 2017. Support at the lows of February 28 March 23 was containing losses.
A week later the index remains below that uptrend channel but those supports are holding. Indeed, it can hardly be coincidental that the clearest recent low (May 18’s intraday bottom) was also February 28’snadir of 5679.90.

However, as you can see from the chart above, price action since that bounce has been inconclusive at best. The bulls have shown no appetite to regain the 5834 level which came before the precipitous fall seen on May 17. But, by the same token, bears have yet to retest that now-critical support level we talked about earlier.
It looks as though something is about to give though. The index is currently flirting oh-so-closely with the top of a downtrend line which has been in place since it topped out back in early May.
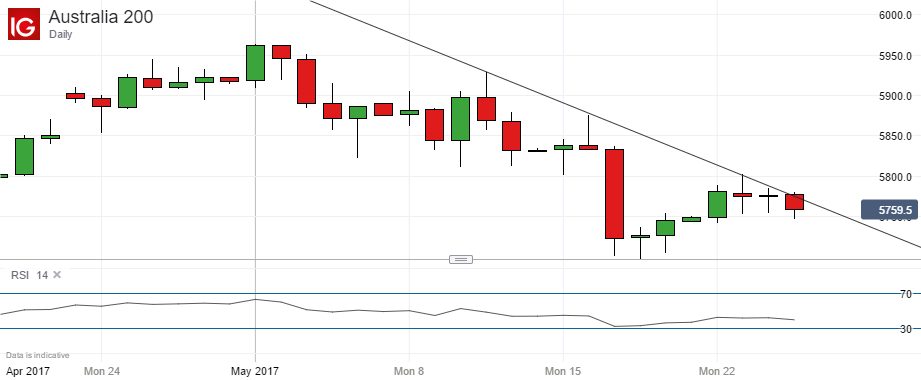
If it can close above this level, currently 5778.70, then the bulls might start to feel a little bolder. If it can’t, then the downtrend strongly suggests another try at that 5679.90 prop and the lows for this year which lurk beneath.
One modest bit of support for the bullish view might come from the index’s Relative Strength Index (RSI). This isn’t flashing any warning signs yet, up or down, but it is meandering down towards territory at which many analysts would think the market was oversold.
The next couple of days’ closing levels should be very interesting indeed.
— Written by David Cottle, DailyFX Research
Contact and follow David on Twitter:@DavidCottleFX