
Analys från DailyFX
$43.79 is Key Level for Crude Oil Prices
The crude oil price bounce on May 5 at $43.79 fell in line with our quarterly forecast.
“The favored patterns we are watching suggest continued dripping in price towards $39-$43. This price range is where the favored patterns begin to diverge with some patterns pointing towards the upper range of $57 and other patterns pointing towards lower levels that may even retest the February 2016 low of $26.”
Page 4 of DailyFX Q2 Oil Forecast written in March 2017
Now that crude oil prices have bounced from $43.79, the Elliott Wave model suggests sideways to higher trade in the coming weeks. The two favored patterns we are following right now is a big triangle or diagonal pattern.
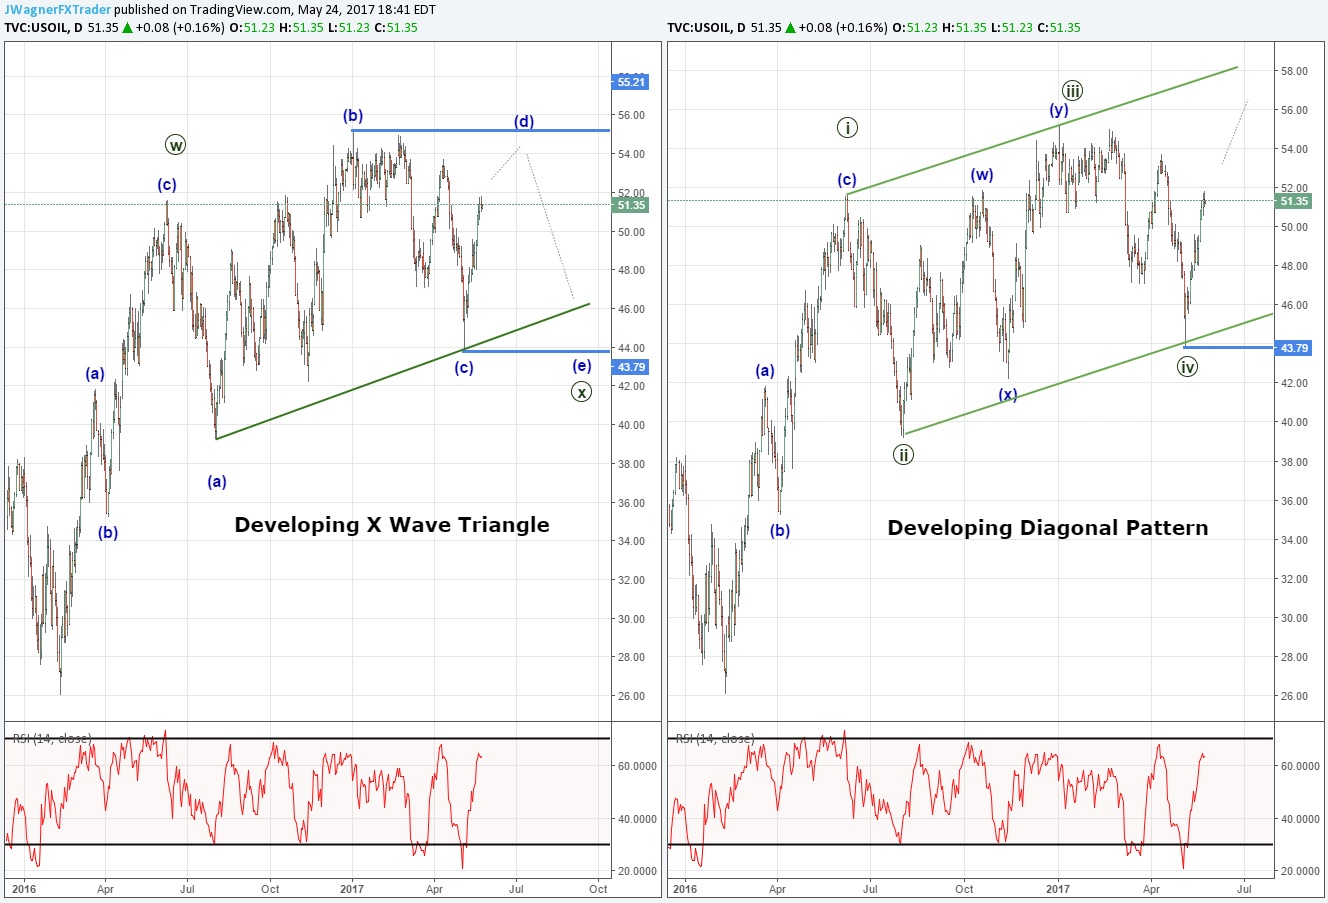
On the split screen above the model on the left illustrates the Elliott Wave triangle and the model on the right illustrates the Elliott Wave diagonal pattern. The wave sequence that creates these two options as the higher probability options is the February to June 2016 up trend. This is clearly a three wave move labeled as (a) – (b) – (c). The subsequent shallow retracement holds the door open for higher prices.
X Wave Triangle
Under this triangle scenario, prices would need to top soon and below $55.21. If a short term pivot forms, we would anticipate one last dip to hold above $43.79 to finish off the triangle pattern. This is an overall bullish pattern that would lead to a break higher. This triangle is valid in the near term so long as crude oil prices are contained between $43.79 and $55.21.
Diagonal Pattern
Under this scenario, the dip to $43.79 was wave four of the five wave diagonal. This sequence implies crude oil prices have begun their ending wave higher. This final wave likely grabs a new high above $57 while holding the green support trend line.
One thing I love about diagonal patterns is that when you identify then near the beginning of wave 5, you can anticipate the maximum distance wave 5 can travel. In this instance, the diagonal pattern is invalidated if crude oil prices exceed $59.77. Above this level, the proposed wave iii would be smaller than wave i and wave v, which violates an Elliott Wave rule.
Below $43.79, we will need to reassess both of the patterns above.
Interested in learning more about Elliott Wave Theory? Grab the beginner and advanced Elliott Wave guides.
—Written by Jeremy Wagner, CEWA-M
Discuss this market with Jeremy in Monday’s US Opening Bell webinar.
Follow on twitter @JWagnerFXTrader .
Join Jeremy’s distribution list.
USDJPY’s Elliott Wave model shows it is vulnerable to a 110.60 retest.
EUR/USD has been ripping lately. Read more on the EURUSD Elliott Wave picture.
Read the recent Dow Jones Elliott Wave article.


What’s inside:
- EURUSD broke the ‘neckline’ of a bearish ‘head-and-shoulders’ pattern, April trend-line
- Resistance in vicinity of 11825/80 likely to keep a lid on further strength
- Targeting the low to mid-11600s with more selling
Confidence is essential to successful trading, see this new guide – ’Building Confidence in Trading’.
Coming into last week we pointed out the likelihood of finally seeing a resolution of the range EURUSD had been stuck in for the past few weeks, and one of the outcomes we made note of as a possibility was for the triggering of a ’head-and-shoulders’ pattern. Indeed, we saw a break of the ’neckline’ along with a drop below the April trend-line. This led to decent selling before a minor bounce took shape during the latter part of last week.
Looking ahead to next week the euro is set up for further losses as the path of least resistance has turned lower. Looking to a capper on any further strength there is resistance in the 11825-11880 area (old support becomes new resistance). As long as the euro stays below this area a downward bias will remain firmly intact.
Looking lower towards support eyes will be on the August low at 11662 and the 2016 high of 11616, of which the latter just happens to align almost precisely with the measured move target of the ‘head-and-shoulders’ pattern (determined by subtracting the height of the pattern from the neckline).
Bottom line: Shorts look set to have the upperhand as a fresh month gets underway as long as the euro remains capped by resistance. On weakness, we’ll be watching how the euro responds to a drop into support levels.
For a longer-term outlook on EURUSD, check out the just released Q4 Forecast.
EURUSD: Daily

—Written by Paul Robinson, Market Analyst
You can receive Paul’s analysis directly via email bysigning up here.
You can follow Paul on Twitter at@PaulRobinonFX.

Why and how do we use IG Client Sentiment in trading? See our guide and real-time data.
EURUSD: Retail trader data shows 37.3% of traders are net-long with the ratio of traders short to long at 1.68 to 1. In fact, traders have remained net-short since Apr 18 when EURUSD traded near 1.07831; price has moved 9.6% higher since then. The number of traders net-long is 15.4% lower than yesterday and 16.4% higher from last week, while the number of traders net-short is 0.4% higher than yesterday and 10.5% lower from last week.
We typically take a contrarian view to crowd sentiment, and the fact traders are net-short suggests EURUSD prices may continue to rise. Positioning is more net-short than yesterday but less net-short from last week. The combination of current sentiment and recent changes gives us a further mixed EURUSD trading bias.
— Written by Christopher Vecchio, CFA, Senior Currency Strategist
To contact Christopher Vecchio, e-mail cvecchio@dailyfx.com
Follow him on Twitter at @CVecchioFX
To be added to Christopher’s e-mail distribution list, please fill out this form

Why and how do we use IG Client Sentiment in trading? See our guide and real-time data.
GBPUSD: Retail trader data shows 38.2% of traders are net-long with the ratio of traders short to long at 1.62 to 1. In fact, traders have remained net-short since Sep 05 when GBPUSD traded near 1.29615; price has moved 3.4% higher since then. The number of traders net-long is 0.1% higher than yesterday and 13.4% higher from last week, while the number of traders net-short is 10.6% lower than yesterday and 18.3% lower from last week.
We typically take a contrarian view to crowd sentiment, and the fact traders are net-short suggests GBPUSD prices may continue to rise. Yet traders are less net-short than yesterday and compared with last week. Recent changes in sentiment warn that the current GBPUSD price trend may soon reverse lower despite the fact traders remain net-short.
— Written by Christopher Vecchio, CFA, Senior Currency Strategist
To contact Christopher Vecchio, e-mail cvecchio@dailyfx.com
Follow him on Twitter at @CVecchioFX
To be added to Christopher’s e-mail distribution list, please fill out this form
- Brent crude up USD 9/bl on the week… ”deal around the corner” narrative fades
- Market Still Betting on Timely Resolution, But Each Day Raises Shortage Risk
- TACO (or Whatever It Was) Sends Oil Lower — Iran Keeps Choking Hormuz
- Oil stress is rising as the supply chains and buffers are drained
- Buy Brent Dec-2026 calls with strike $150/b!
-
Analys från DailyFX10 år ago
EUR/USD Flirts with Monthly Close Under 30 Year Trendline
-
Marknadsnyheter6 år ago
BrainCool AB (publ): erhåller bidrag (grant) om 0,9 MSEK från Vinnova för bolagets projekt inom behandling av covid-19 patienter med hög feber
-

 Marknadsnyheter3 år ago
Upptäck de bästa verktygen för att analysera Bitcoin!
-
Analys från DailyFX13 år ago
Japanese Yen Breakout or Fakeout? ZAR/JPY May Provide the Answer
-

 Marknadsnyheter3 år ago
Därför föredrar svenska spelare att spela via mobiltelefonen
-
Analys från DailyFX13 år ago
Price & Time: Key Levels to Watch in the Aftermath of NFP
-
Analys från DailyFX9 år ago
Gold Prices Falter at Resistance: Is the Bullish Run Finished?
-
 Nyheter7 år ago
Teknisk analys med Martin Hallström och Nils Brobacke