
Analys från DailyFX
Gold Prices Falter at Resistance: Is the Bullish Run Finished?
Talking Points:
– Gold prices remained offered through most of this week after reversing at the 2016 resistance zone that runs from $1,350-$1,375.
– Short-term support has begun to show in a key Fibonacci zone, between the 76.4% and 78.6% retracements of last year’s July-December down-trend. But bulls haven’t yet been able to take-over, even with another North Korean missile test. Bulls may have to wait for a resumption of the two-month up-trend.
– Retail sentiment remains elevated in Gold, with IG Client Sentiment currently reading +2.3. Given retail sentiment’s traditional contrarian nature, this is bearish for Gold prices.
– Want to see how Gold prices have held up to our DailyFX forecasts? Click here for full access.
To receive James Stanley’s Analysis directly via email, please sign up here.
Gold prices have been on a fairly consistent run since early July after price action tested below the $1,205 level. Since then, we’ve seen a 12.7% advance as a series of factors have contributed to heightened demand. The most notable and obvious of these drivers is the situation brewing around North Korea. As the threat of thermonuclear conflict has increased, so has demand in Gold. This has driven Gold prices through a series of resistance levels and back towards the 2016 high at $1,375; but since trading over $1,350 last week, Gold has seen a dearth of demand and prices have begun falling in the first legitimate sell-off that we’ve seen in the yellow metal in more than two months.
Two-Month Rally in Gold Prices (blue) Drives to 2016 Resistance Zone $1,350-$1,375 (red)
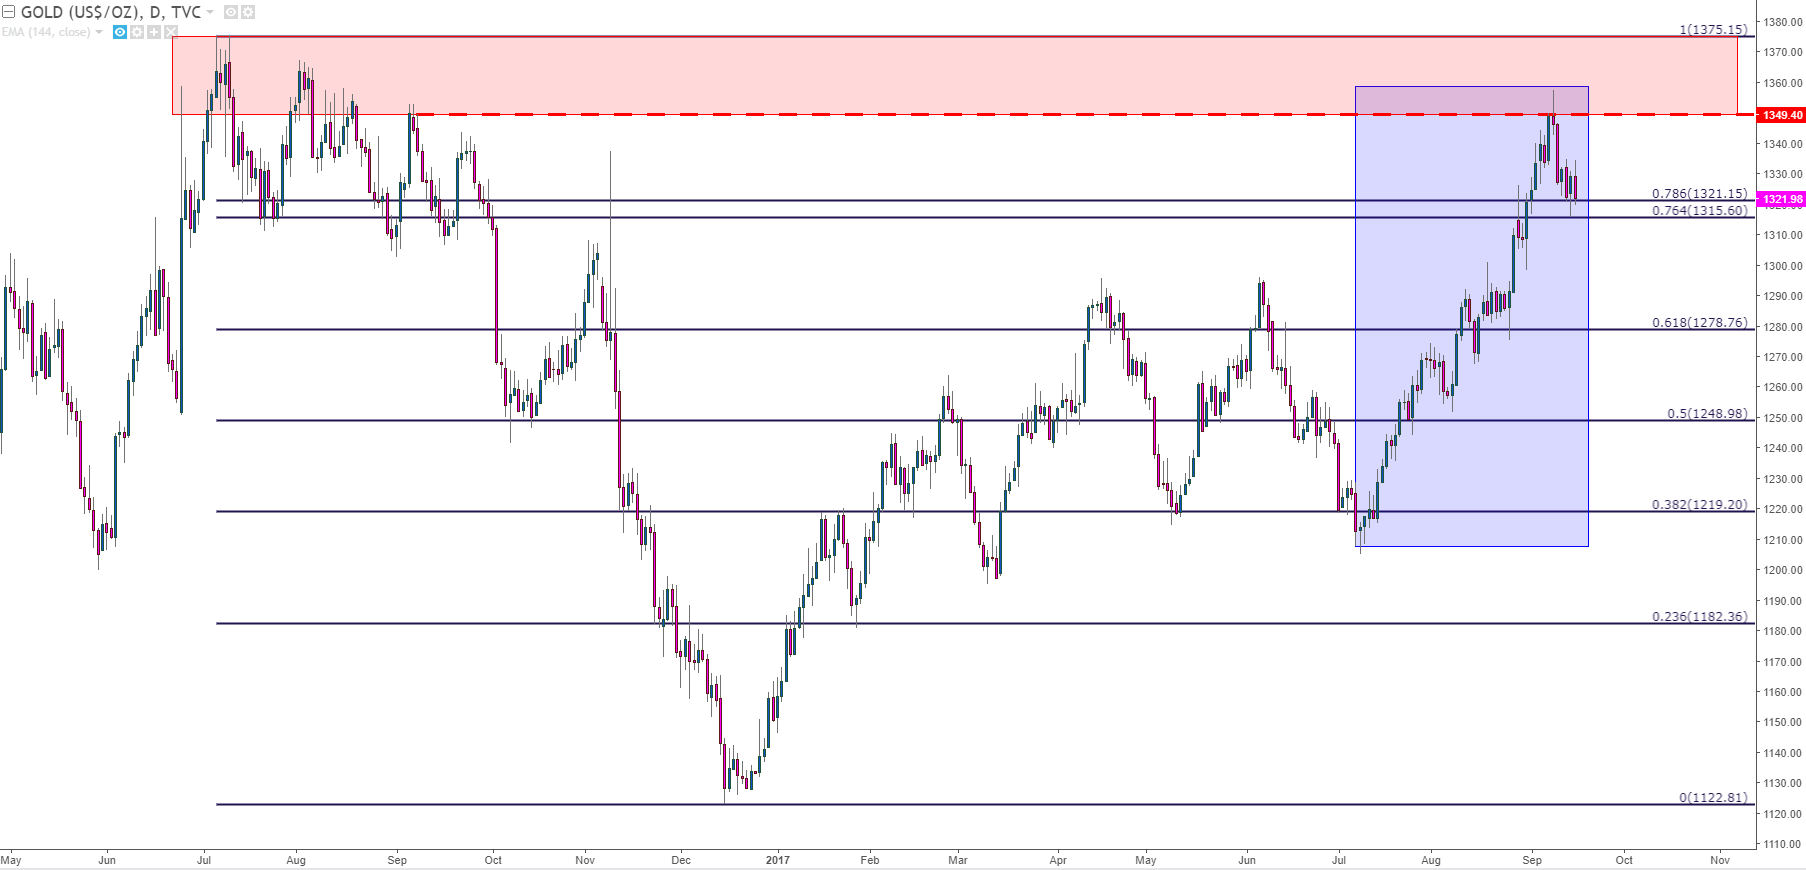
Chart prepared by James Stanley
After penetrating the zone of resistance that had developed last summer from $1,350-$1,375, short-term bearish price action has begun to show. Even with North Korea conducting another missile test and while the U.S. Dollar remained relatively bearish against most currencies, sellers controlled short-term price action in Gold, driving prices down to a key support zone.
If we take the major move of last year’s high down the December, pre-rate hike low; the 76.4% retracement comes in at $1,315.60 while the 78.6% retracement is at $1,321.15. This creates a zone that’s, at least so far, held the lows during this retracement. We’re looking at this zone in the below chart, demarcated in blue.
Gold Hourly: Higher-Low Support Holds Between 76.4 and 78.6% retracements
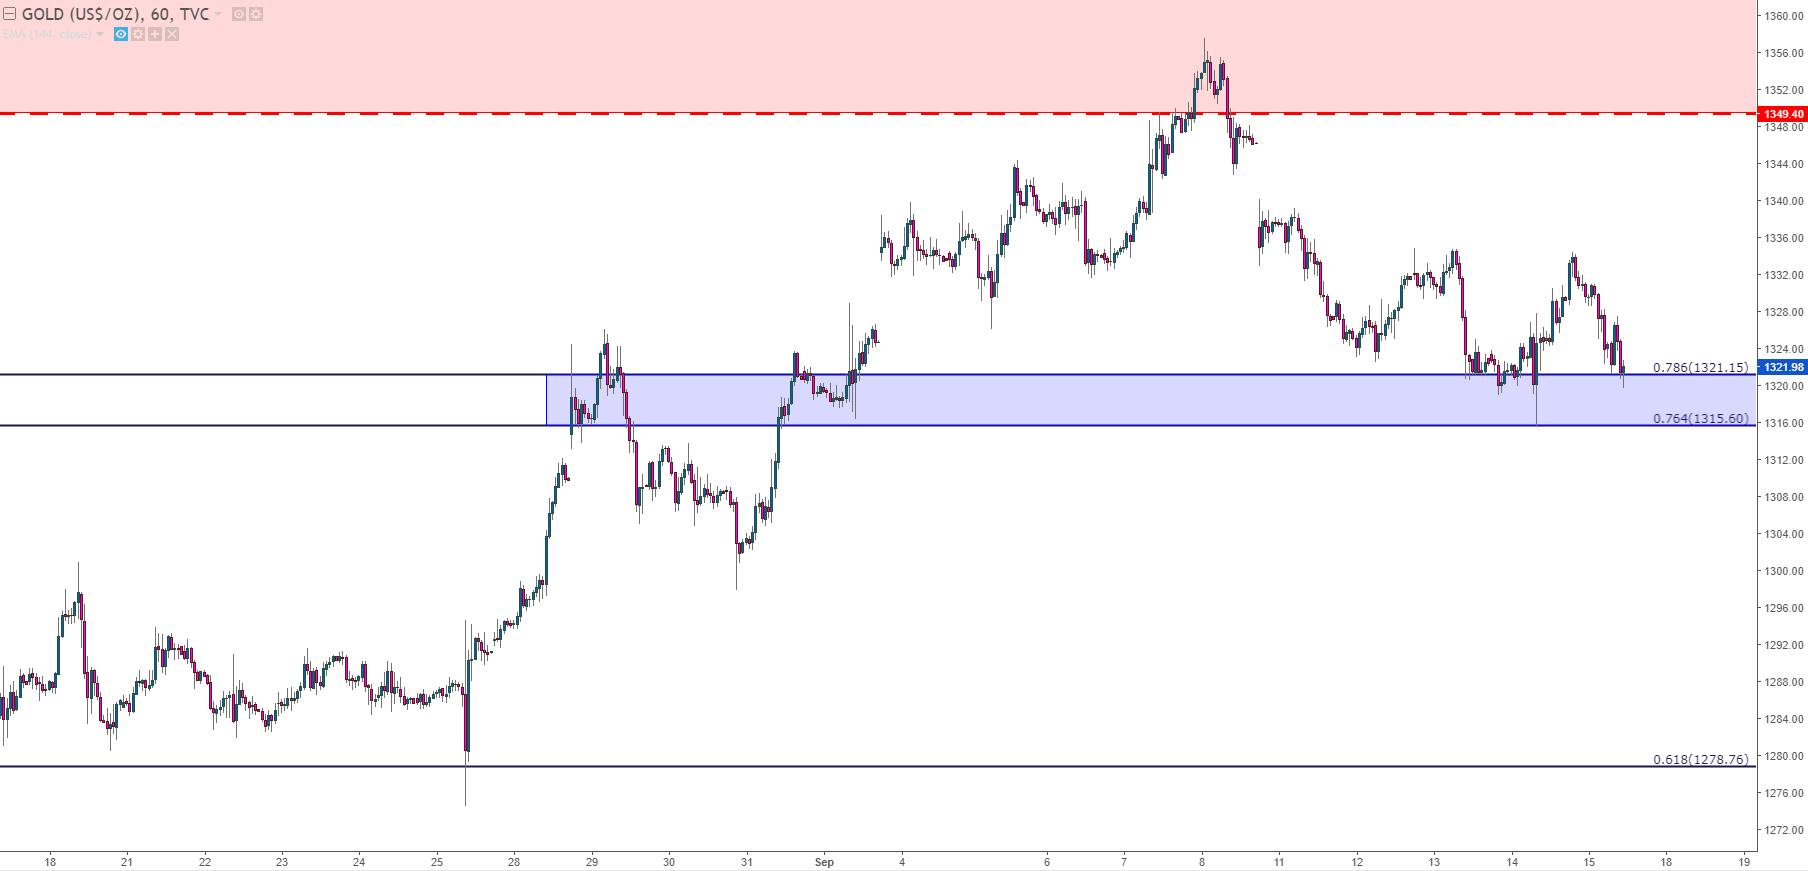
Chart prepared by James Stanley
The fact that Gold prices haven’t put in a more vigorous response to this support zone combined with the fact that bulls failed to take over after another North Korean missile flew over Japan, it would appear that more weakness is on the horizon for Gold prices. As the bullish run was heating up from early-July, sentiment had grown pretty aggressively on the long side of the trade. My colleague, Paul Robinson, discussed this earlier in the week in the article, ‘Rapid Case of Gold Buying Cause for Pause’, and given what we’ve seen in price action this week, it doesn’t appear as though bullish continuation is yet ready for take-off.
This can lead to a deeper retracement in Gold prices, and below we’re looking at three support zones of interest below the current area. This could be looked at as potential take-off points for the longer-term bullish theme, with the expectation that an eventual re-test of $1,375 will be in the cards; while these levels can also function as short-side targets for those looking to take on bearish exposure to Gold. If Gold prices slip below the $1,275 level, then the confluent zone around $1,250 becomes attractive for short-side profit targets.
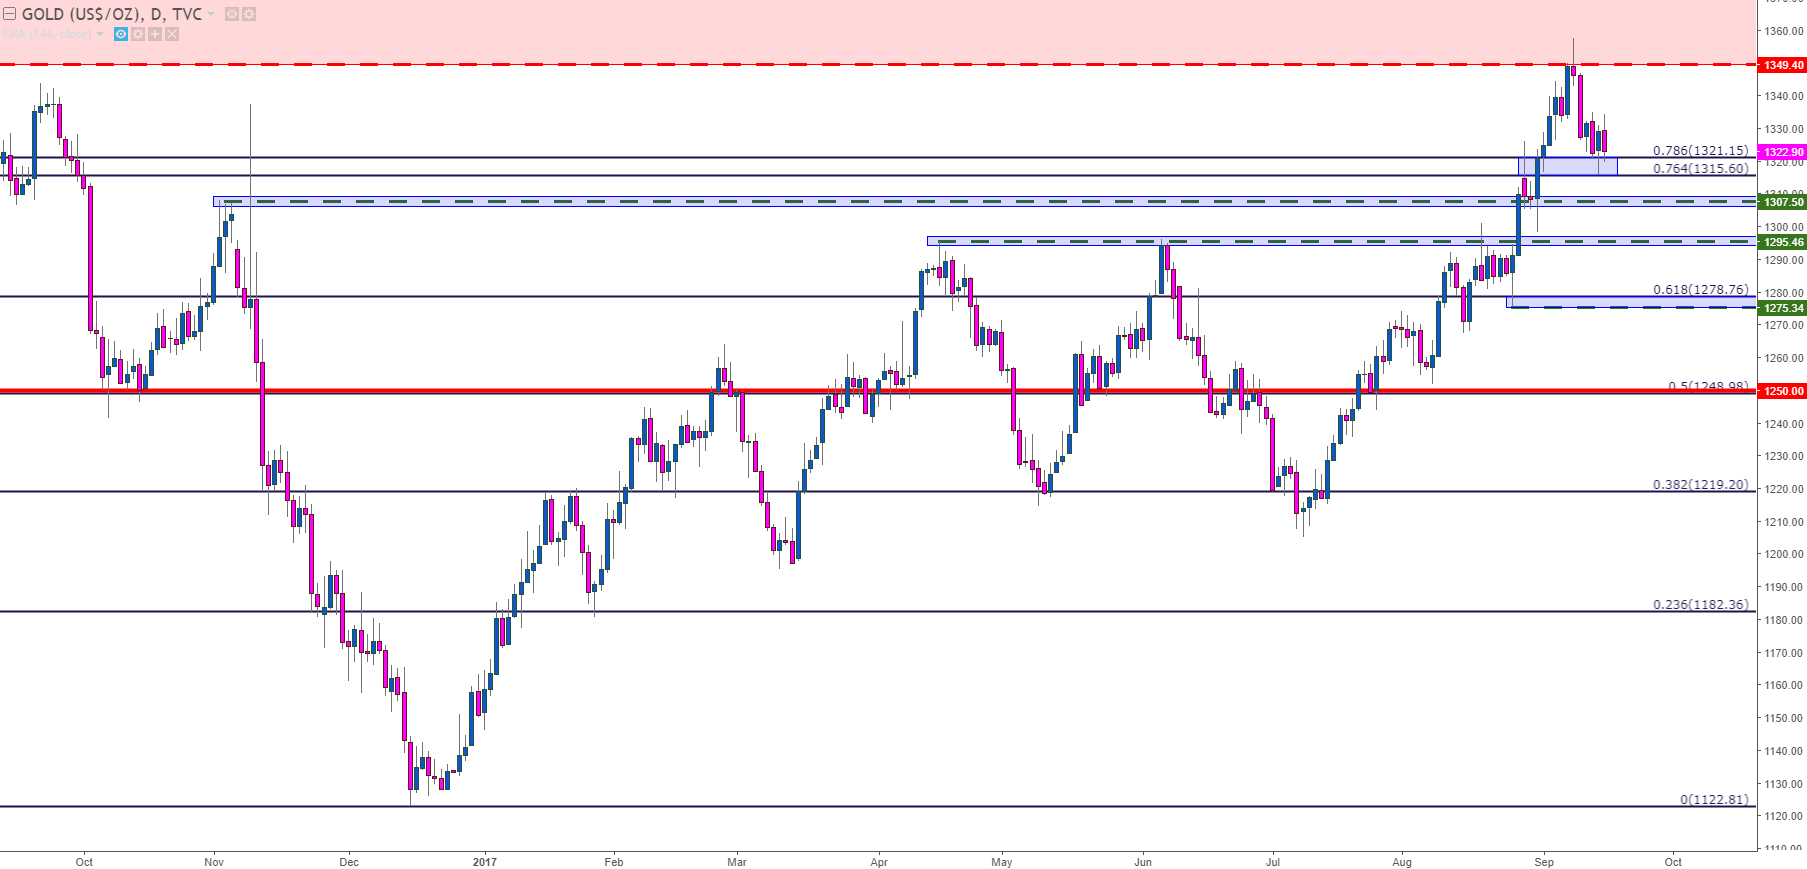
Chart prepared by James Stanley
— Written by James Stanley, Strategist for DailyFX.com
To receive James Stanley’s analysis directly via email, please SIGN UP HERE
Contact and follow James on Twitter: @JStanleyFX


What’s inside:
- EURUSD broke the ‘neckline’ of a bearish ‘head-and-shoulders’ pattern, April trend-line
- Resistance in vicinity of 11825/80 likely to keep a lid on further strength
- Targeting the low to mid-11600s with more selling
Confidence is essential to successful trading, see this new guide – ’Building Confidence in Trading’.
Coming into last week we pointed out the likelihood of finally seeing a resolution of the range EURUSD had been stuck in for the past few weeks, and one of the outcomes we made note of as a possibility was for the triggering of a ’head-and-shoulders’ pattern. Indeed, we saw a break of the ’neckline’ along with a drop below the April trend-line. This led to decent selling before a minor bounce took shape during the latter part of last week.
Looking ahead to next week the euro is set up for further losses as the path of least resistance has turned lower. Looking to a capper on any further strength there is resistance in the 11825-11880 area (old support becomes new resistance). As long as the euro stays below this area a downward bias will remain firmly intact.
Looking lower towards support eyes will be on the August low at 11662 and the 2016 high of 11616, of which the latter just happens to align almost precisely with the measured move target of the ‘head-and-shoulders’ pattern (determined by subtracting the height of the pattern from the neckline).
Bottom line: Shorts look set to have the upperhand as a fresh month gets underway as long as the euro remains capped by resistance. On weakness, we’ll be watching how the euro responds to a drop into support levels.
For a longer-term outlook on EURUSD, check out the just released Q4 Forecast.
EURUSD: Daily

—Written by Paul Robinson, Market Analyst
You can receive Paul’s analysis directly via email bysigning up here.
You can follow Paul on Twitter at@PaulRobinonFX.

Why and how do we use IG Client Sentiment in trading? See our guide and real-time data.
EURUSD: Retail trader data shows 37.3% of traders are net-long with the ratio of traders short to long at 1.68 to 1. In fact, traders have remained net-short since Apr 18 when EURUSD traded near 1.07831; price has moved 9.6% higher since then. The number of traders net-long is 15.4% lower than yesterday and 16.4% higher from last week, while the number of traders net-short is 0.4% higher than yesterday and 10.5% lower from last week.
We typically take a contrarian view to crowd sentiment, and the fact traders are net-short suggests EURUSD prices may continue to rise. Positioning is more net-short than yesterday but less net-short from last week. The combination of current sentiment and recent changes gives us a further mixed EURUSD trading bias.
— Written by Christopher Vecchio, CFA, Senior Currency Strategist
To contact Christopher Vecchio, e-mail cvecchio@dailyfx.com
Follow him on Twitter at @CVecchioFX
To be added to Christopher’s e-mail distribution list, please fill out this form

Why and how do we use IG Client Sentiment in trading? See our guide and real-time data.
GBPUSD: Retail trader data shows 38.2% of traders are net-long with the ratio of traders short to long at 1.62 to 1. In fact, traders have remained net-short since Sep 05 when GBPUSD traded near 1.29615; price has moved 3.4% higher since then. The number of traders net-long is 0.1% higher than yesterday and 13.4% higher from last week, while the number of traders net-short is 10.6% lower than yesterday and 18.3% lower from last week.
We typically take a contrarian view to crowd sentiment, and the fact traders are net-short suggests GBPUSD prices may continue to rise. Yet traders are less net-short than yesterday and compared with last week. Recent changes in sentiment warn that the current GBPUSD price trend may soon reverse lower despite the fact traders remain net-short.
— Written by Christopher Vecchio, CFA, Senior Currency Strategist
To contact Christopher Vecchio, e-mail cvecchio@dailyfx.com
Follow him on Twitter at @CVecchioFX
To be added to Christopher’s e-mail distribution list, please fill out this form
- Brent crude up USD 9/bl on the week… ”deal around the corner” narrative fades
- Market Still Betting on Timely Resolution, But Each Day Raises Shortage Risk
- TACO (or Whatever It Was) Sends Oil Lower — Iran Keeps Choking Hormuz
- Oil stress is rising as the supply chains and buffers are drained
- Buy Brent Dec-2026 calls with strike $150/b!
-
Analys från DailyFX10 år ago
EUR/USD Flirts with Monthly Close Under 30 Year Trendline
-
Marknadsnyheter6 år ago
BrainCool AB (publ): erhåller bidrag (grant) om 0,9 MSEK från Vinnova för bolagets projekt inom behandling av covid-19 patienter med hög feber
-

 Marknadsnyheter3 år ago
Upptäck de bästa verktygen för att analysera Bitcoin!
-
Analys från DailyFX13 år ago
Japanese Yen Breakout or Fakeout? ZAR/JPY May Provide the Answer
-

 Marknadsnyheter3 år ago
Därför föredrar svenska spelare att spela via mobiltelefonen
-
Analys från DailyFX13 år ago
Price & Time: Key Levels to Watch in the Aftermath of NFP
-
 Nyheter7 år ago
Teknisk analys med Martin Hallström och Nils Brobacke
-
Marknadsnyheter8 år ago
Tudorza reduces exacerbations and demonstrates cardiovascular safety in COPD patients