
Analys från DailyFX
Crude Oil Price Forecast: Strong Bounce on US EIA Inventory Drop
Highlights:
- Crude Oil Technical Strategy: watching last week’s low at $45.38 as key support
- US Crude inventories fell for the eighth week helping to calm oversupply fears
- IGCS Sentiment highlight: Sharp rise in short positions provides contrarian signal to look for upside
Crude oil looks ready to rally higher, according to shorter term technical analysis. Last week’s low looks to be a strong point of support from Elliott Wave analysis, which holds a potential count where last week’s low was the end of a Bullish Correction. Once a correction is over, trader’s should look for moves higher that can be traded.
When looking at the fundamental picture, it’s worth noting the good, the bad, and the troublesome. First, the good was that US stockpiles fell for the eighth straight week on rising demand led mainly from refiners. Refiners are processing more oil than last year in the US by 60,000 bpd. Aligning with the end of the likely seasonal peak is the potential of the first Gulf Coast Hurricane, currently named Tropical Depression Harvey, to hit Texas since 2008. However, we could see a direct hit effect refiners more, which are laid across the Gulf and are a key demand point of Oil. There was a strong amount of Latin American Imports coming mainly from Venezuela as well as impressive US gasoline exports that were near 700,000 and at the highest since June. The troublesome point is that seasonality is nearing its likely cycle peak that could mean we are about to see a seasonal drop, which could lead to a stall in the aggressive draws of inventory.
Give the strong rise in Crude Oil since Q3 began, click here to see the opportunities we’re watching in Oil.
The chart below shows that we’re not out of the wood’s yet in terms of soon being to break down. As mentioned above a breakdown below last week’s low at $45.38/bbl would favor a further breakdown is upon us. However, if we can see a move above last week’s high at $49.13/bbl would be strong since not seen since the last week in July that we’re breaking above resistance from the 2017 downtrend, which could mean we’re about to see a retest of $50/bbl. If such a move is going to happen, this time of year is a good fundamental time for it to occur.
While price remains below resistance of $49.13, I’ll stay cautiously optimistic as we continue to see a weak dollar, positive signs in the physical market, and other commodity blocs doing well that are correlated to Oil demand. All of this is happening at a time when commodity seasonality trends are bullish.
JoinTyler in hisDaily Closing Bell webinars at 3 pm ETto discuss tradeable market developments.
Crude Oil continuing rebound from $45.38, last week’s low

Chart Created by Tyler Yell, CMT
Crude Oil Sentiment: Net-long crude positions bias provides contrarian signal to look lower
The sentiment highlight section is designed to help you see how DailyFX utilizes the insights derived from IG Client Sentiment, and how client positioning can lead to trade ideas. If you have any questions on this indicator, you are welcome to reach out to the author of this article with questions at tyell@dailyfx.com.
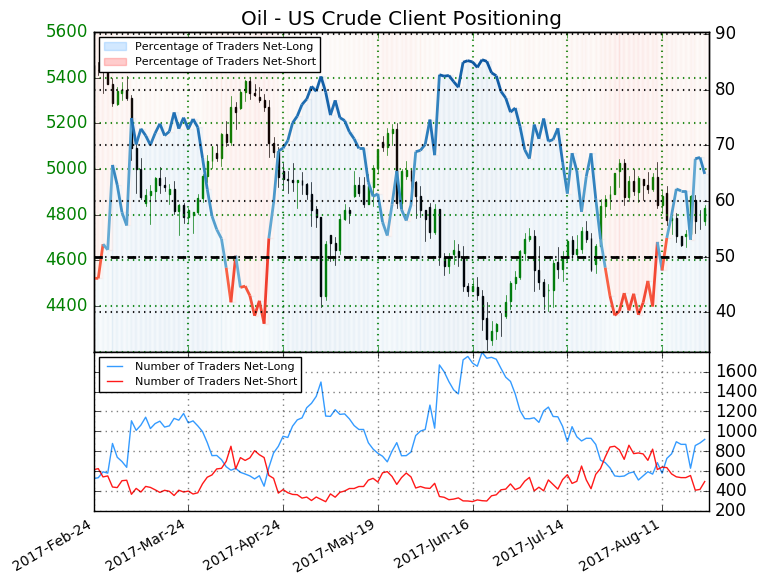
Oil – US Crude: Retail trader data shows 64.9% of traders are net-long with the ratio of traders long to short at 1.85 to 1. In fact, traders have remained net-long since Aug 14 when Oil – US Crude traded near 4785.9; price has moved 0.8% higher since then. The number of traders net-long is 2.6% higher than yesterday and 12.7% higher from last week, while the number of traders net-short is 7.8% higher than yesterday and 18.5% lower from last week.
We typically take a contrarian view to crowd sentiment, and the fact traders are net-long suggests Oil – US Crude prices may continue to fall. Positioning is less net-long than yesterday but more net-long from last week. The combination of current sentiment and recent changes gives us a further mixed Oil – US Crude trading bias. (emphasis mine).
—
Written by Tyler Yell, CMT, Currency Analyst Trading Instructor for DailyFX.com
To receive Tyler’s analysis directly via email, please SIGN UP HERE
Contact and discuss markets with Tyler on Twitter: @ForexYell


What’s inside:
- EURUSD broke the ‘neckline’ of a bearish ‘head-and-shoulders’ pattern, April trend-line
- Resistance in vicinity of 11825/80 likely to keep a lid on further strength
- Targeting the low to mid-11600s with more selling
Confidence is essential to successful trading, see this new guide – ’Building Confidence in Trading’.
Coming into last week we pointed out the likelihood of finally seeing a resolution of the range EURUSD had been stuck in for the past few weeks, and one of the outcomes we made note of as a possibility was for the triggering of a ’head-and-shoulders’ pattern. Indeed, we saw a break of the ’neckline’ along with a drop below the April trend-line. This led to decent selling before a minor bounce took shape during the latter part of last week.
Looking ahead to next week the euro is set up for further losses as the path of least resistance has turned lower. Looking to a capper on any further strength there is resistance in the 11825-11880 area (old support becomes new resistance). As long as the euro stays below this area a downward bias will remain firmly intact.
Looking lower towards support eyes will be on the August low at 11662 and the 2016 high of 11616, of which the latter just happens to align almost precisely with the measured move target of the ‘head-and-shoulders’ pattern (determined by subtracting the height of the pattern from the neckline).
Bottom line: Shorts look set to have the upperhand as a fresh month gets underway as long as the euro remains capped by resistance. On weakness, we’ll be watching how the euro responds to a drop into support levels.
For a longer-term outlook on EURUSD, check out the just released Q4 Forecast.
EURUSD: Daily

—Written by Paul Robinson, Market Analyst
You can receive Paul’s analysis directly via email bysigning up here.
You can follow Paul on Twitter at@PaulRobinonFX.

Why and how do we use IG Client Sentiment in trading? See our guide and real-time data.
EURUSD: Retail trader data shows 37.3% of traders are net-long with the ratio of traders short to long at 1.68 to 1. In fact, traders have remained net-short since Apr 18 when EURUSD traded near 1.07831; price has moved 9.6% higher since then. The number of traders net-long is 15.4% lower than yesterday and 16.4% higher from last week, while the number of traders net-short is 0.4% higher than yesterday and 10.5% lower from last week.
We typically take a contrarian view to crowd sentiment, and the fact traders are net-short suggests EURUSD prices may continue to rise. Positioning is more net-short than yesterday but less net-short from last week. The combination of current sentiment and recent changes gives us a further mixed EURUSD trading bias.
— Written by Christopher Vecchio, CFA, Senior Currency Strategist
To contact Christopher Vecchio, e-mail cvecchio@dailyfx.com
Follow him on Twitter at @CVecchioFX
To be added to Christopher’s e-mail distribution list, please fill out this form

Why and how do we use IG Client Sentiment in trading? See our guide and real-time data.
GBPUSD: Retail trader data shows 38.2% of traders are net-long with the ratio of traders short to long at 1.62 to 1. In fact, traders have remained net-short since Sep 05 when GBPUSD traded near 1.29615; price has moved 3.4% higher since then. The number of traders net-long is 0.1% higher than yesterday and 13.4% higher from last week, while the number of traders net-short is 10.6% lower than yesterday and 18.3% lower from last week.
We typically take a contrarian view to crowd sentiment, and the fact traders are net-short suggests GBPUSD prices may continue to rise. Yet traders are less net-short than yesterday and compared with last week. Recent changes in sentiment warn that the current GBPUSD price trend may soon reverse lower despite the fact traders remain net-short.
— Written by Christopher Vecchio, CFA, Senior Currency Strategist
To contact Christopher Vecchio, e-mail cvecchio@dailyfx.com
Follow him on Twitter at @CVecchioFX
To be added to Christopher’s e-mail distribution list, please fill out this form
- Crude oil comment: Pulling back after technical exhaustion and disappointing US inventory data. Low Cushing stocks lifting eyebrows
- The rally continues with good help from Russian crude exports at 16mths low
- Brent takes a pause, but a yet softer USD could propel it higher
- Brent crude falling back along with softer nat gas prices
- Brent prices slip on USD surge despite tight inventory conditions
-
Analys från DailyFX9 år ago
EUR/USD Flirts with Monthly Close Under 30 Year Trendline
-

 Marknadsnyheter2 år ago
Upptäck de bästa verktygen för att analysera Bitcoin!
-
Marknadsnyheter5 år ago
BrainCool AB (publ): erhåller bidrag (grant) om 0,9 MSEK från Vinnova för bolagets projekt inom behandling av covid-19 patienter med hög feber
-
Analys från DailyFX11 år ago
Japanese Yen Breakout or Fakeout? ZAR/JPY May Provide the Answer
-
Analys från DailyFX11 år ago
Price & Time: Key Levels to Watch in the Aftermath of NFP
-

 Marknadsnyheter2 år ago
Därför föredrar svenska spelare att spela via mobiltelefonen
-
Analys från DailyFX7 år ago
Gold Prices Falter at Resistance: Is the Bullish Run Finished?
-
 Nyheter6 år ago
Teknisk analys med Martin Hallström och Nils Brobacke