
Analys från DailyFX
Crude Oil Traders See Biggest Reduction in Long Positions on Record
Talking Points:
- The CFTC’s net speculative positioning data showed a 75,983 contract drop in bullish oil exposure
- Oil prices themselves have been held to a range that is the smallest 52 week rolling avg in 3 years
- Volume in oil trading continues to grow despite the lack of direction
See how retail traders are positioning in the FX majors, indices, gold and oil intraday using the IG speculative positioning data on the DailyFX Sentiment page.
Implied volatility levels underlying oil have sunk to the same low levels that have plagued so many other physical and capital market assets across the financial system. Yet, this lack of anticipation and even the lack of a clear trend for this commodity hasn’t tempered speculation behind the the market. In fact, the reality is quite the opposite. We have seen volume steadily rise; while just this past week, net speculative futures positioning posted a record swing in exposure. Does this portend a coming change in this important market or has speculation simply run far ahead of actual market activity?
Taking a look at recent price action for US-based crude oil, the abnormal turnover isn’t obvious at first blush. While there are notable swings over the past year, they are hardly of the violent or persistent nature that we have seen from this and other markets in previous cycles. Recently, the WTI (West Texas Intermediate) standard has been unable to break from a 50 – 42 range over the past three months. Looking further back, the energy benchmark has seen a moving 12-month range that is the smallest since the Summer of 2014 – competing with current conditions for title of the most complacent periods in recent financial history.
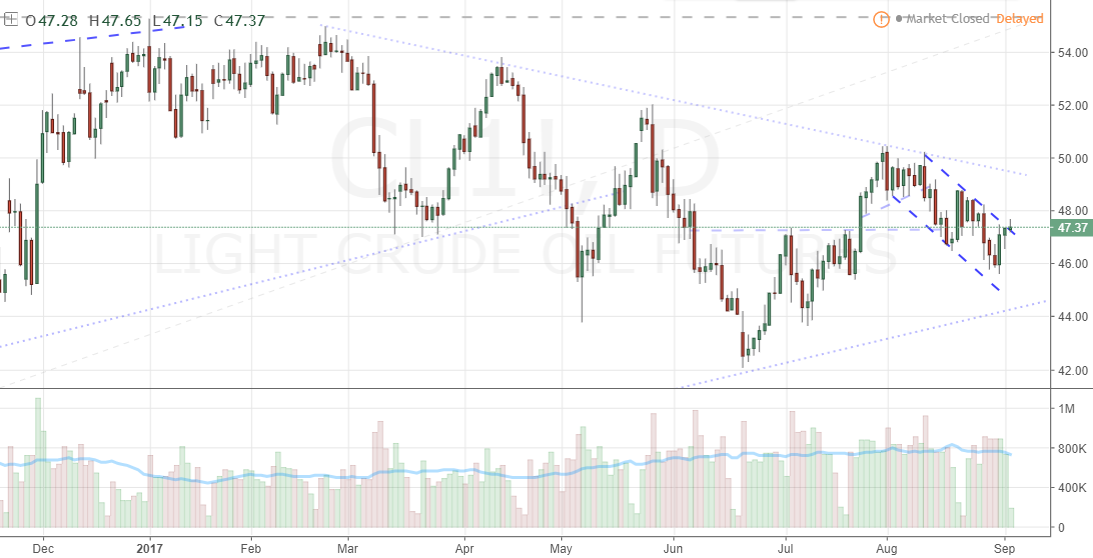
Chart created by John Kicklighter using Tradingview on DailyFX.com
Yet, when we look at a little more historical context; a different view of the market starts to emerge. Despite the reduced range and the dimimished volatility readings from measures like the CBOE’s Oil Volatity Index, we find that volume has climbed to record highs that have more than doubled the averages of the from just three years before. Similarly, open interest (total participation in the market) has soared to a record high in a persistently rising trend.

Chart created by John Kicklighter using Tradingview on DailyFX.com
There are a number of possible explanations for this dramatic shift in market activity – though there is no way to claim one is the definitive reason. The growing interests among producers from OPEC’s members to emergent US shale producers creates an effort to promote market direction and transferring transactions to other financial centers around the world (more US oil means more US transactions). Crude may capture more of the global speculative interest because it carries more volatility than the likes of equities and doesn’t draw the skepticism surrounding a persistent trend that shares earn. Perhaps this is the evoluation of a market that is slowly being replaced due to inevitable supply and demand constaints (peak oil and alternative energy).
Regardless, we have seen what it can do to positioning and market levels. Below is the CFTC’s Commitment of Traders (COT) report highlighting net speculative positioning in oil specifically. Besides the deviation in long interest and the mundane level of the commdity itself, we have the measure of weekly change in speculative bearing. As it happens, this past week’s net change in the (persistently) long exposure of the market suffered its largest drop on records going back decades to the tune of 75,983 contracts.

Chart created by John Kicklighter using Data from Bloomberg and the CFTC
Though this past week’s swing in the net long position is the largest on record, there have been a few proximately large bearish dives that have followed otherwise abrupt but limited slides in price action – legs through November and March. Both of those previous instances called short-term bottoms but certainly didn’t rebalance speculation and promote the next trend. This time around, the price slump was far more modest, which likely is supported by fundamental factors such as the additional glut added by Hurricane Harvey as well as the tentative fade of concern related to the North Korea-West tensions. Will that restraint evaporate? Time and volatility will tell.
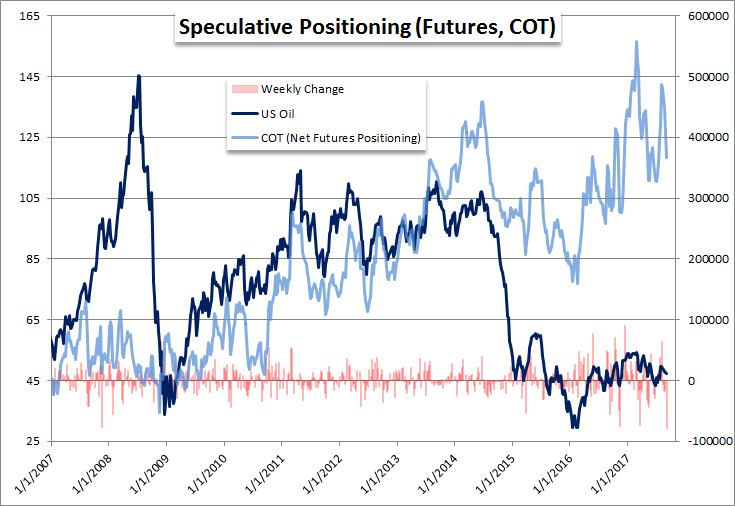
Chart created by John Kicklighter using Data from Bloomberg and the CFTC
To receive John’s analysis directly via email, please SIGN UP HERE


What’s inside:
- EURUSD broke the ‘neckline’ of a bearish ‘head-and-shoulders’ pattern, April trend-line
- Resistance in vicinity of 11825/80 likely to keep a lid on further strength
- Targeting the low to mid-11600s with more selling
Confidence is essential to successful trading, see this new guide – ’Building Confidence in Trading’.
Coming into last week we pointed out the likelihood of finally seeing a resolution of the range EURUSD had been stuck in for the past few weeks, and one of the outcomes we made note of as a possibility was for the triggering of a ’head-and-shoulders’ pattern. Indeed, we saw a break of the ’neckline’ along with a drop below the April trend-line. This led to decent selling before a minor bounce took shape during the latter part of last week.
Looking ahead to next week the euro is set up for further losses as the path of least resistance has turned lower. Looking to a capper on any further strength there is resistance in the 11825-11880 area (old support becomes new resistance). As long as the euro stays below this area a downward bias will remain firmly intact.
Looking lower towards support eyes will be on the August low at 11662 and the 2016 high of 11616, of which the latter just happens to align almost precisely with the measured move target of the ‘head-and-shoulders’ pattern (determined by subtracting the height of the pattern from the neckline).
Bottom line: Shorts look set to have the upperhand as a fresh month gets underway as long as the euro remains capped by resistance. On weakness, we’ll be watching how the euro responds to a drop into support levels.
For a longer-term outlook on EURUSD, check out the just released Q4 Forecast.
EURUSD: Daily

—Written by Paul Robinson, Market Analyst
You can receive Paul’s analysis directly via email bysigning up here.
You can follow Paul on Twitter at@PaulRobinonFX.

Why and how do we use IG Client Sentiment in trading? See our guide and real-time data.
EURUSD: Retail trader data shows 37.3% of traders are net-long with the ratio of traders short to long at 1.68 to 1. In fact, traders have remained net-short since Apr 18 when EURUSD traded near 1.07831; price has moved 9.6% higher since then. The number of traders net-long is 15.4% lower than yesterday and 16.4% higher from last week, while the number of traders net-short is 0.4% higher than yesterday and 10.5% lower from last week.
We typically take a contrarian view to crowd sentiment, and the fact traders are net-short suggests EURUSD prices may continue to rise. Positioning is more net-short than yesterday but less net-short from last week. The combination of current sentiment and recent changes gives us a further mixed EURUSD trading bias.
— Written by Christopher Vecchio, CFA, Senior Currency Strategist
To contact Christopher Vecchio, e-mail cvecchio@dailyfx.com
Follow him on Twitter at @CVecchioFX
To be added to Christopher’s e-mail distribution list, please fill out this form

Why and how do we use IG Client Sentiment in trading? See our guide and real-time data.
GBPUSD: Retail trader data shows 38.2% of traders are net-long with the ratio of traders short to long at 1.62 to 1. In fact, traders have remained net-short since Sep 05 when GBPUSD traded near 1.29615; price has moved 3.4% higher since then. The number of traders net-long is 0.1% higher than yesterday and 13.4% higher from last week, while the number of traders net-short is 10.6% lower than yesterday and 18.3% lower from last week.
We typically take a contrarian view to crowd sentiment, and the fact traders are net-short suggests GBPUSD prices may continue to rise. Yet traders are less net-short than yesterday and compared with last week. Recent changes in sentiment warn that the current GBPUSD price trend may soon reverse lower despite the fact traders remain net-short.
— Written by Christopher Vecchio, CFA, Senior Currency Strategist
To contact Christopher Vecchio, e-mail cvecchio@dailyfx.com
Follow him on Twitter at @CVecchioFX
To be added to Christopher’s e-mail distribution list, please fill out this form
- Brent crude up USD 9/bl on the week… ”deal around the corner” narrative fades
- Market Still Betting on Timely Resolution, But Each Day Raises Shortage Risk
- TACO (or Whatever It Was) Sends Oil Lower — Iran Keeps Choking Hormuz
- Oil stress is rising as the supply chains and buffers are drained
- Buy Brent Dec-2026 calls with strike $150/b!
-
Analys från DailyFX10 år ago
EUR/USD Flirts with Monthly Close Under 30 Year Trendline
-
Marknadsnyheter6 år ago
BrainCool AB (publ): erhåller bidrag (grant) om 0,9 MSEK från Vinnova för bolagets projekt inom behandling av covid-19 patienter med hög feber
-

 Marknadsnyheter3 år ago
Upptäck de bästa verktygen för att analysera Bitcoin!
-
Analys från DailyFX13 år ago
Japanese Yen Breakout or Fakeout? ZAR/JPY May Provide the Answer
-

 Marknadsnyheter3 år ago
Därför föredrar svenska spelare att spela via mobiltelefonen
-
Analys från DailyFX13 år ago
Price & Time: Key Levels to Watch in the Aftermath of NFP
-
Analys från DailyFX9 år ago
Gold Prices Falter at Resistance: Is the Bullish Run Finished?
-
 Nyheter7 år ago
Teknisk analys med Martin Hallström och Nils Brobacke