
Analys från DailyFX
Dollar Price Analysis: Why You Should Watch This Dollar Bounce
Talking Points:
- DXY Technical Strategy: DXY remains in “sell the rips” mode below 49.08
- DXY appears to be bouncing off an extreme downside target, may be subject to month-end flows
- Fed Funds Future bets take the probability of a Fed hike in 2017 down to 1/3
- IG Client Sentiment Highlight: EUR (57.6% of DXY) sentiment favors ST test lower
Beware of month end flows. They can be a squirrelly bunch. As explained in response to a question by a faithful attendee of FX Closing Bell, month end flows are typically erratic after a strong trend had taken place over the month, such as the mind-numbingly weak US Dollar. Funds from around the world to lock in gains on the foresight that shorted the USD at the beginning of the month or at earlier times in the year will close out their short DXY trade. The flows from this act will result in entering a long position to neutralize the short, and in so doing provide a short-term lift to the previously downtrodden currency.
Add to month-end flows;the US had a double punch of positive data points on Wednesday. First, GDP for 2Q beat estimates and came alongside an ADP employment data, ahead of Friday’s Non-Farm Payroll number, which also beat economist’s expectations. After the positive round of US data, DXY pushed higher and took EUR JPY to session lows. The EUR fell below the Jackson Hole breakout level of 1.1910, and internal structural support looks to 1.1828 as support. A break and close below this level may signal a deeper setback is under way.
Equally impressive is the move lower in JPY. USD/JPY pushed to a weekly high of 110.44, breaking above the base line of Ichimoku (26-day midpoint), and pushing further away from the YTD low set in April at 108.13. The strong push away from the price range of the bearish extreme for 2017 opens up a test to 110.95. We should be on the watch for a further breakdown if risk-off sentiment gathers pace. However, it is fair to say that the market has defended 108.13 very well and it is difficult to build short exposure just above this point.
Both EUR JPY make up the largest percentage of the DXY, so they are worth analyzing individually when looking to the DXY.
Want to learn how to trade from our experts? We recently updated and added new trading guides here.
When looking at the DXY chart, you can see we have bounced along the bottom of a bearish channel that earlier helped to catch the low in late July. By no means am I arguing that the DXY downtrend is done for 2017.Even if it is, far be it from me to be as bold to call for such on so little evidence. From a fundamental perspective, Fed Funds Future bets take theprobability of a Fed hike in 2017 down to 1/3. However, it is worth noting that given the month-end volatility, the retracement in EUR/USD and USD/JPY, and the potential upswing in US Data, we could see a retracement that makes a blind US Dollar Index short position unwise on many accounts.
Strong resistance to the anticipated corrective move higher would be 93.03 and 94.08. Rallies will likely be sold here as the hedge funds that have built up their short positions, those who have yet to close out will likely work to defend their position. Only upon a break of 93.03/94.08, would it be worth shifting from a bearish bias on USD longer term to neutral.
If you would be interested in seeing how retail traders’ are bettingin key markets, see IG Client Sentiment here!
Join Tyler in his Daily Closing Bell webinars at 3 pm ET to discuss this market.
DXY below 94.08 keeps thefocus on downside extension, EUR/USD 1.1828
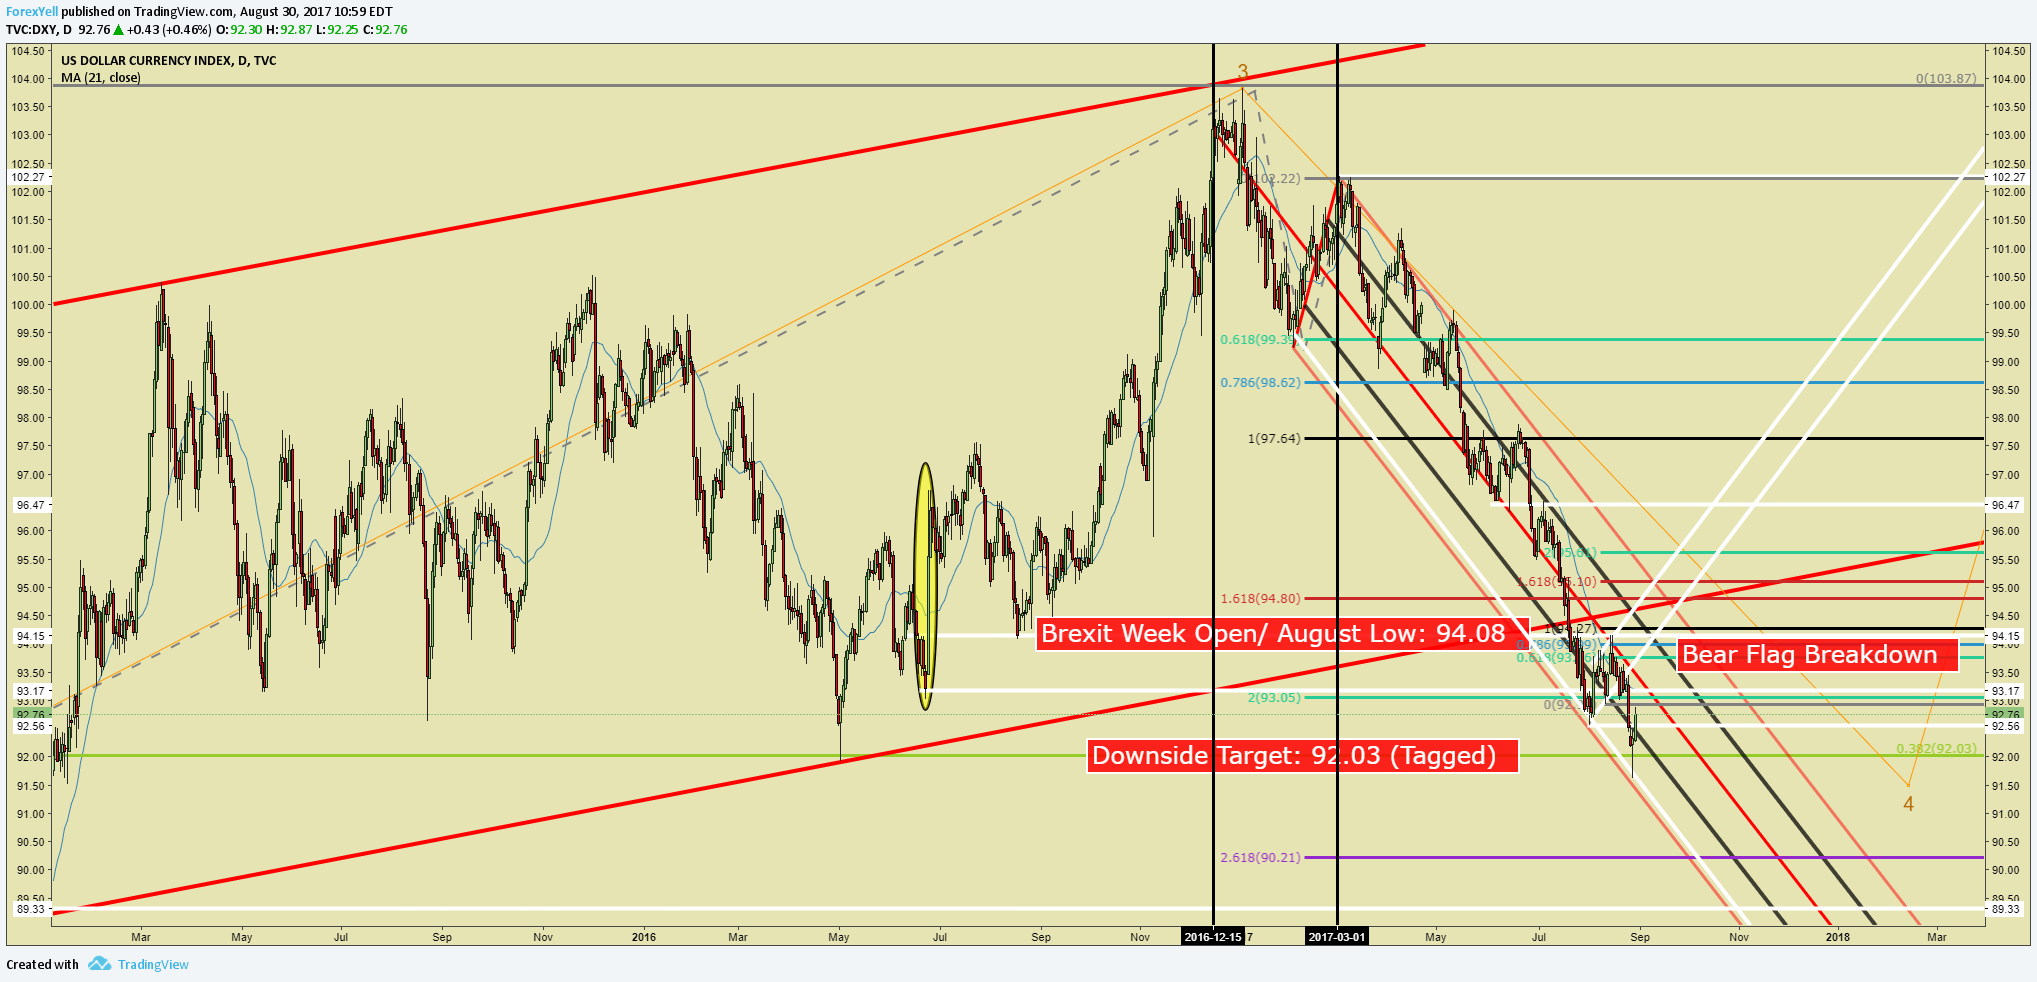
Chart Created by Tyler Yell, CMT
IG Client Sentiment Highlight: EUR (57.6% of DXY) sentiment favors further upside in EUR/USD
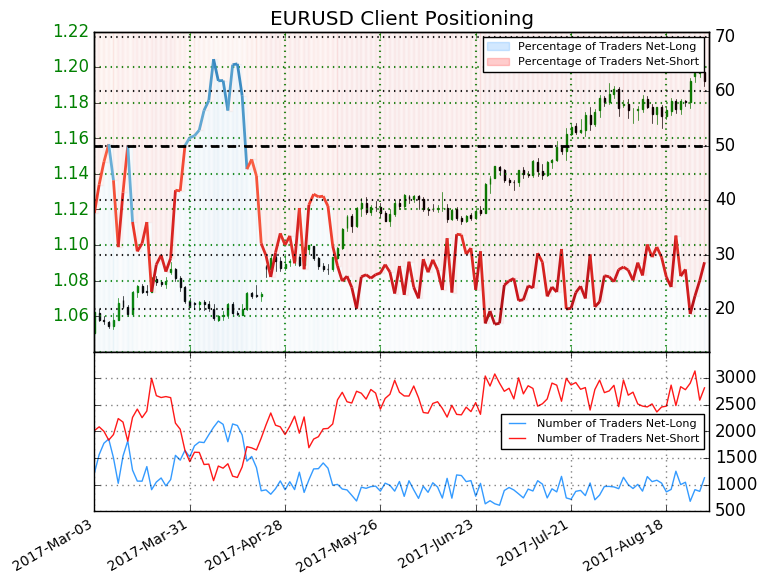
EURUSD: Retail trader data shows 28.6% of traders are net-long with the ratio of traders short to long at 2.49 to 1. In fact, traders have remained net-short since Apr 18 when EURUSD traded near 1.07646; price has moved 10.7% higher since then. The number of traders net-long is 17.7% higher than yesterday and 11.2% lower from last week, while the number of traders net-short is 6.4% lower than yesterday and 10.0% higher from last week.
We typically take a contrarian view to crowd sentiment, and the fact traders are net-short suggests EURUSD prices may continue to rise. Positioning is less net-short than yesterday but more net-short from last week. The combination of current sentiment and recent changes gives us a further mixed EURUSD trading bias. (Emphasis mine)
—
Written by Tyler Yell, CMT, Currency Analyst Trading Instructor for DailyFX.com
To receive Tyler’s analysis directly via email, please SIGN UP HERE
Contact and discuss markets with Tyler on Twitter: @ForexYell


What’s inside:
- EURUSD broke the ‘neckline’ of a bearish ‘head-and-shoulders’ pattern, April trend-line
- Resistance in vicinity of 11825/80 likely to keep a lid on further strength
- Targeting the low to mid-11600s with more selling
Confidence is essential to successful trading, see this new guide – ’Building Confidence in Trading’.
Coming into last week we pointed out the likelihood of finally seeing a resolution of the range EURUSD had been stuck in for the past few weeks, and one of the outcomes we made note of as a possibility was for the triggering of a ’head-and-shoulders’ pattern. Indeed, we saw a break of the ’neckline’ along with a drop below the April trend-line. This led to decent selling before a minor bounce took shape during the latter part of last week.
Looking ahead to next week the euro is set up for further losses as the path of least resistance has turned lower. Looking to a capper on any further strength there is resistance in the 11825-11880 area (old support becomes new resistance). As long as the euro stays below this area a downward bias will remain firmly intact.
Looking lower towards support eyes will be on the August low at 11662 and the 2016 high of 11616, of which the latter just happens to align almost precisely with the measured move target of the ‘head-and-shoulders’ pattern (determined by subtracting the height of the pattern from the neckline).
Bottom line: Shorts look set to have the upperhand as a fresh month gets underway as long as the euro remains capped by resistance. On weakness, we’ll be watching how the euro responds to a drop into support levels.
For a longer-term outlook on EURUSD, check out the just released Q4 Forecast.
EURUSD: Daily

—Written by Paul Robinson, Market Analyst
You can receive Paul’s analysis directly via email bysigning up here.
You can follow Paul on Twitter at@PaulRobinonFX.

Why and how do we use IG Client Sentiment in trading? See our guide and real-time data.
EURUSD: Retail trader data shows 37.3% of traders are net-long with the ratio of traders short to long at 1.68 to 1. In fact, traders have remained net-short since Apr 18 when EURUSD traded near 1.07831; price has moved 9.6% higher since then. The number of traders net-long is 15.4% lower than yesterday and 16.4% higher from last week, while the number of traders net-short is 0.4% higher than yesterday and 10.5% lower from last week.
We typically take a contrarian view to crowd sentiment, and the fact traders are net-short suggests EURUSD prices may continue to rise. Positioning is more net-short than yesterday but less net-short from last week. The combination of current sentiment and recent changes gives us a further mixed EURUSD trading bias.
— Written by Christopher Vecchio, CFA, Senior Currency Strategist
To contact Christopher Vecchio, e-mail cvecchio@dailyfx.com
Follow him on Twitter at @CVecchioFX
To be added to Christopher’s e-mail distribution list, please fill out this form

Why and how do we use IG Client Sentiment in trading? See our guide and real-time data.
GBPUSD: Retail trader data shows 38.2% of traders are net-long with the ratio of traders short to long at 1.62 to 1. In fact, traders have remained net-short since Sep 05 when GBPUSD traded near 1.29615; price has moved 3.4% higher since then. The number of traders net-long is 0.1% higher than yesterday and 13.4% higher from last week, while the number of traders net-short is 10.6% lower than yesterday and 18.3% lower from last week.
We typically take a contrarian view to crowd sentiment, and the fact traders are net-short suggests GBPUSD prices may continue to rise. Yet traders are less net-short than yesterday and compared with last week. Recent changes in sentiment warn that the current GBPUSD price trend may soon reverse lower despite the fact traders remain net-short.
— Written by Christopher Vecchio, CFA, Senior Currency Strategist
To contact Christopher Vecchio, e-mail cvecchio@dailyfx.com
Follow him on Twitter at @CVecchioFX
To be added to Christopher’s e-mail distribution list, please fill out this form
- Oil product price pain is set to rise as the Strait of Hormuz stays closed into summer
- Brent crude up USD 9/bl on the week… ”deal around the corner” narrative fades
- Market Still Betting on Timely Resolution, But Each Day Raises Shortage Risk
- TACO (or Whatever It Was) Sends Oil Lower — Iran Keeps Choking Hormuz
- Oil stress is rising as the supply chains and buffers are drained
-
Analys från DailyFX11 år ago
EUR/USD Flirts with Monthly Close Under 30 Year Trendline
-
Marknadsnyheter6 år ago
BrainCool AB (publ): erhåller bidrag (grant) om 0,9 MSEK från Vinnova för bolagets projekt inom behandling av covid-19 patienter med hög feber
-

 Marknadsnyheter3 år ago
Upptäck de bästa verktygen för att analysera Bitcoin!
-
Analys från DailyFX13 år ago
Japanese Yen Breakout or Fakeout? ZAR/JPY May Provide the Answer
-

 Marknadsnyheter3 år ago
Därför föredrar svenska spelare att spela via mobiltelefonen
-
Analys från DailyFX13 år ago
Price & Time: Key Levels to Watch in the Aftermath of NFP
-
Analys från DailyFX9 år ago
Gold Prices Falter at Resistance: Is the Bullish Run Finished?
-
 Nyheter8 år ago
Teknisk analys med Martin Hallström och Nils Brobacke