
Analys från DailyFX
GBP/USD Approaches Important Long Term Price Zone
In our last report, we noted how the Elliott Wave technical picture cleared up. Though GBP/USD sliced right through 1.3450 like a hot knife cutting through butter, the bigger wave picture is still intact. Despite the Bank of England and market participants believing a rate hike is coming, the technical picture for GBP/USD is not as rosy. We believe Cable is in a terminal wave at three different degrees of trend. This suggests a reversal may be looming overhead.
The Elliott Wave model we are following points our trend “GPS” to the coordinates of wave v of ((C)) of Y of 4. For those familiar with Elliott Wave, those first three coordinates are ending waves. That means once this move higher exhausts, GBP/USD may stage a top that lasts for several months. We are seeing a cluster of wave relationships appear in the 1.3775 to 1.3918 price zone so a reversal (if one happens) may take place there.
Struggling with your trading? This could be why.
Since this could be the final moves of wave 4, that implies a fifth and final wave to come. We know from our Elliott Wave lessons that fourth waves in an impulse do not overlap the price territory of the first wave of the same impulse. In the daily chart below, notice how the first wave low appears at 1.46. Therefore, Cable can technically move up to this level and the larger impulse (which is a bearish impulse) remains intact.
GBP/USD Long Term Reversal?
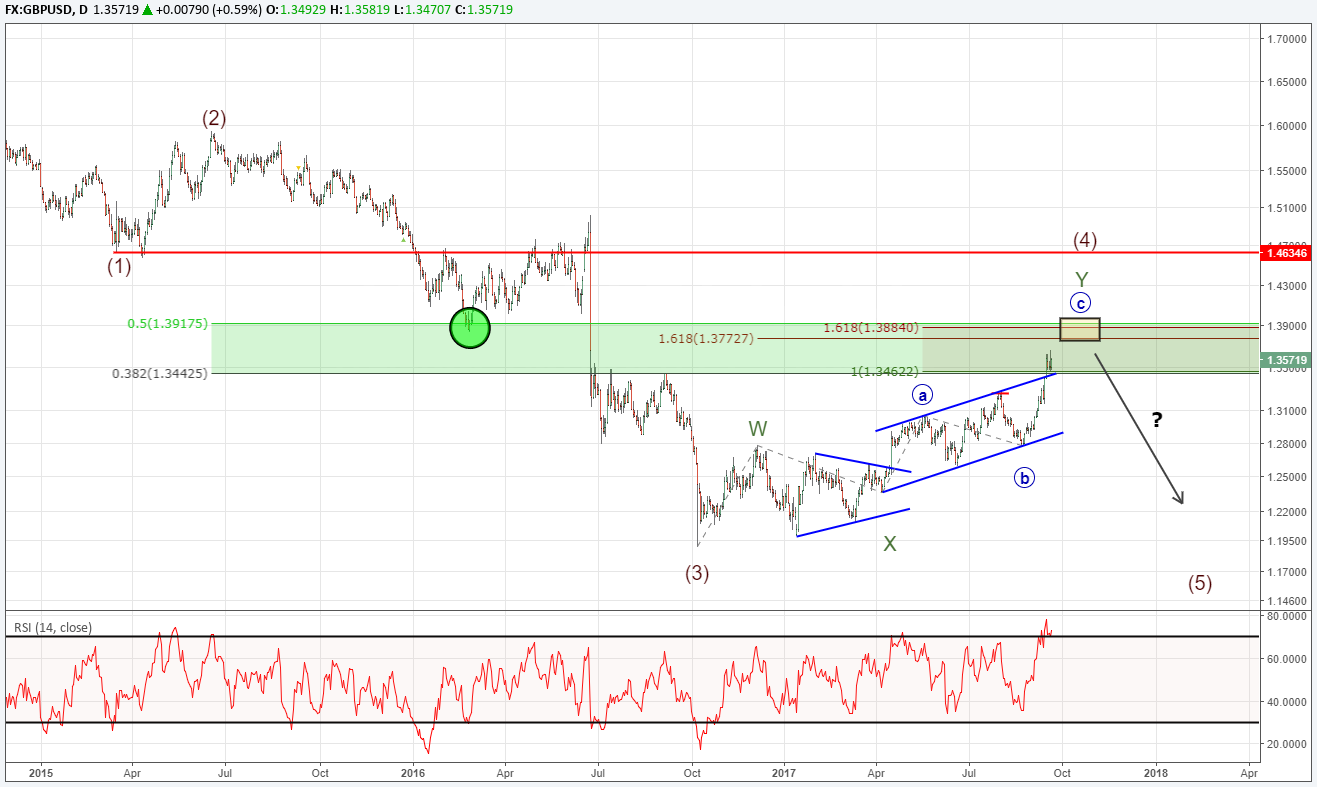
In the chart above, we can see four wave relationships appearing in the 1.3773 to 1.3918 price zone. Plus, there is a fifth wave relationship at 1.3775 which we will talk about in a minute. This indicates the next couple hundred pips are to be closely monitored.
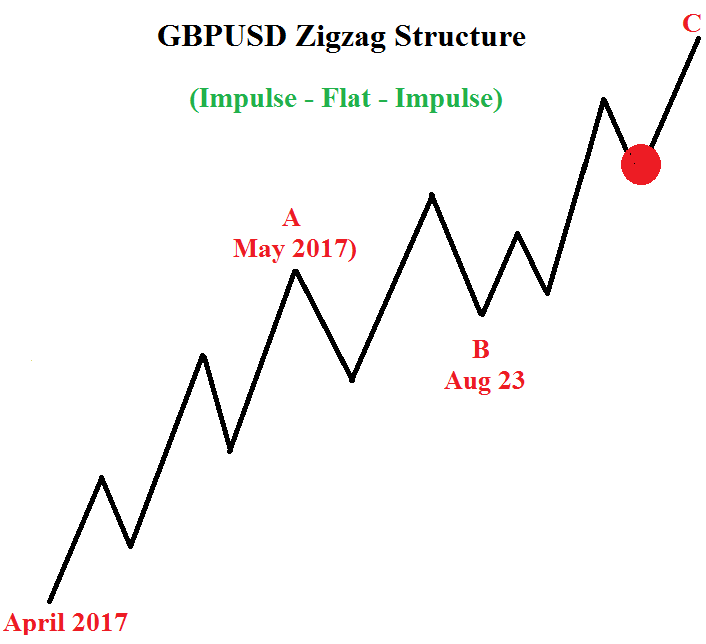
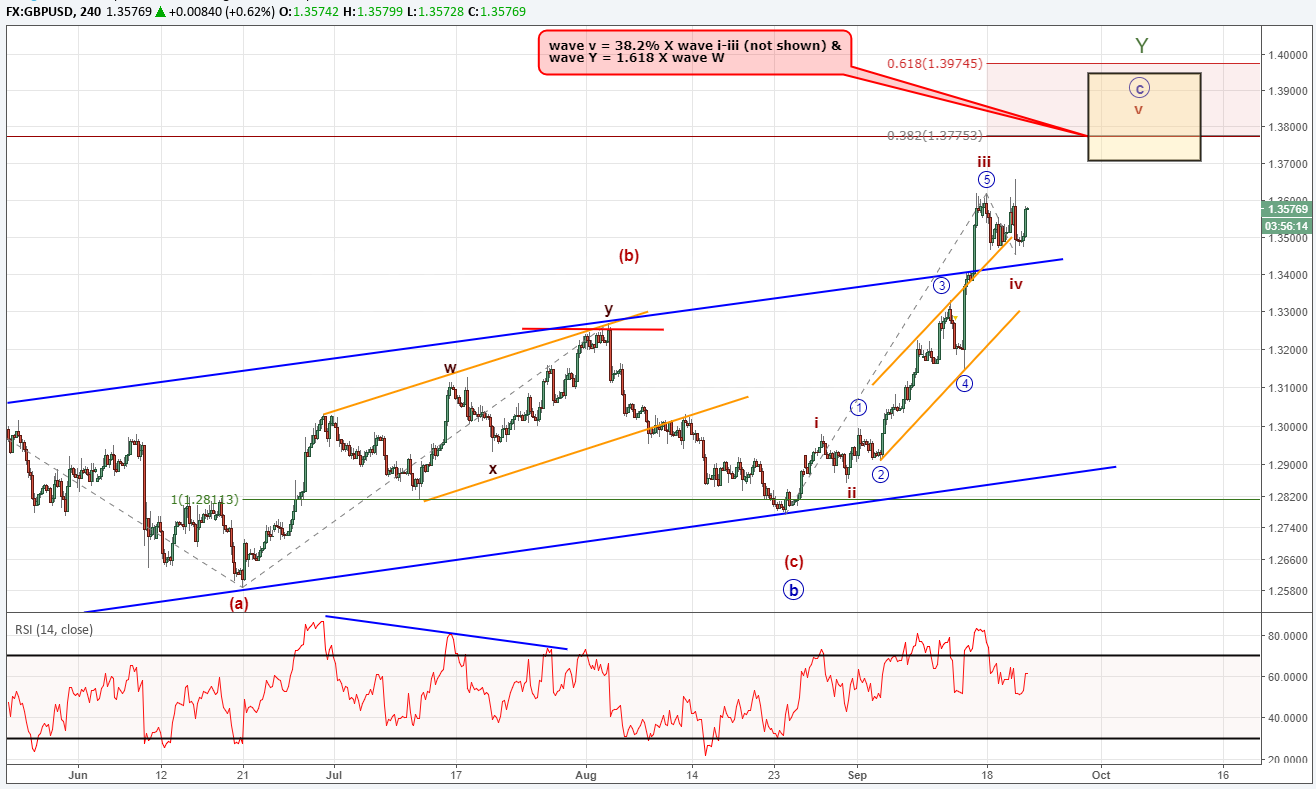
When we zoom into an intraday chart, it appears we are near the beginning of the fifth and final wave higher in the sequence. Below is an idealized chart showing the latest zigzag structure.
From our Elliott Wave studies, we know that fifth waves tend to travel about 38 or 61% the length of waves one through three. Applying this study to our charts we can add another wave relationship to the cluster near 1.3775. Price does not need to make it to this level for the wave picture to remain valid, but the confluence of wave relationships gives us a price zone to watch closely.
Bottom Line
When looking at the intraday chart above, we are waiting for the impulse wave from August 24 to end. There is a cluster of wave relationships on the daily and intraday chart between 1.3773 to 1.3918 which hints Cable may struggle to advance farther beyond that zone. If a reversal is successful, we are anticipating new lows to 1.19.
Get started learning about Elliott Wave. Grab the beginner and advanced Elliott Wave trading guide.
New to FX trading? We created this guide just for you.
—Written by Jeremy Wagner, CEWA-M
Discuss this market with Jeremy in Monday’s US Opening Bell webinar.
For further study on Elliott Wave patterns, watch these one hour long webinar recordings devoted to each topic. [registration required]
Follow on twitter @JWagnerFXTrader .
Join Jeremy’s distribution list.
Recent Elliott Wave articles by Jeremy:
USDJPY Advance May Kick Off a New Uptrend


What’s inside:
- EURUSD broke the ‘neckline’ of a bearish ‘head-and-shoulders’ pattern, April trend-line
- Resistance in vicinity of 11825/80 likely to keep a lid on further strength
- Targeting the low to mid-11600s with more selling
Confidence is essential to successful trading, see this new guide – ’Building Confidence in Trading’.
Coming into last week we pointed out the likelihood of finally seeing a resolution of the range EURUSD had been stuck in for the past few weeks, and one of the outcomes we made note of as a possibility was for the triggering of a ’head-and-shoulders’ pattern. Indeed, we saw a break of the ’neckline’ along with a drop below the April trend-line. This led to decent selling before a minor bounce took shape during the latter part of last week.
Looking ahead to next week the euro is set up for further losses as the path of least resistance has turned lower. Looking to a capper on any further strength there is resistance in the 11825-11880 area (old support becomes new resistance). As long as the euro stays below this area a downward bias will remain firmly intact.
Looking lower towards support eyes will be on the August low at 11662 and the 2016 high of 11616, of which the latter just happens to align almost precisely with the measured move target of the ‘head-and-shoulders’ pattern (determined by subtracting the height of the pattern from the neckline).
Bottom line: Shorts look set to have the upperhand as a fresh month gets underway as long as the euro remains capped by resistance. On weakness, we’ll be watching how the euro responds to a drop into support levels.
For a longer-term outlook on EURUSD, check out the just released Q4 Forecast.
EURUSD: Daily

—Written by Paul Robinson, Market Analyst
You can receive Paul’s analysis directly via email bysigning up here.
You can follow Paul on Twitter at@PaulRobinonFX.

Why and how do we use IG Client Sentiment in trading? See our guide and real-time data.
EURUSD: Retail trader data shows 37.3% of traders are net-long with the ratio of traders short to long at 1.68 to 1. In fact, traders have remained net-short since Apr 18 when EURUSD traded near 1.07831; price has moved 9.6% higher since then. The number of traders net-long is 15.4% lower than yesterday and 16.4% higher from last week, while the number of traders net-short is 0.4% higher than yesterday and 10.5% lower from last week.
We typically take a contrarian view to crowd sentiment, and the fact traders are net-short suggests EURUSD prices may continue to rise. Positioning is more net-short than yesterday but less net-short from last week. The combination of current sentiment and recent changes gives us a further mixed EURUSD trading bias.
— Written by Christopher Vecchio, CFA, Senior Currency Strategist
To contact Christopher Vecchio, e-mail cvecchio@dailyfx.com
Follow him on Twitter at @CVecchioFX
To be added to Christopher’s e-mail distribution list, please fill out this form

Why and how do we use IG Client Sentiment in trading? See our guide and real-time data.
GBPUSD: Retail trader data shows 38.2% of traders are net-long with the ratio of traders short to long at 1.62 to 1. In fact, traders have remained net-short since Sep 05 when GBPUSD traded near 1.29615; price has moved 3.4% higher since then. The number of traders net-long is 0.1% higher than yesterday and 13.4% higher from last week, while the number of traders net-short is 10.6% lower than yesterday and 18.3% lower from last week.
We typically take a contrarian view to crowd sentiment, and the fact traders are net-short suggests GBPUSD prices may continue to rise. Yet traders are less net-short than yesterday and compared with last week. Recent changes in sentiment warn that the current GBPUSD price trend may soon reverse lower despite the fact traders remain net-short.
— Written by Christopher Vecchio, CFA, Senior Currency Strategist
To contact Christopher Vecchio, e-mail cvecchio@dailyfx.com
Follow him on Twitter at @CVecchioFX
To be added to Christopher’s e-mail distribution list, please fill out this form
- Oil product price pain is set to rise as the Strait of Hormuz stays closed into summer
- Brent crude up USD 9/bl on the week… ”deal around the corner” narrative fades
- Market Still Betting on Timely Resolution, But Each Day Raises Shortage Risk
- TACO (or Whatever It Was) Sends Oil Lower — Iran Keeps Choking Hormuz
- Oil stress is rising as the supply chains and buffers are drained
-
Analys från DailyFX11 år ago
EUR/USD Flirts with Monthly Close Under 30 Year Trendline
-
Marknadsnyheter6 år ago
BrainCool AB (publ): erhåller bidrag (grant) om 0,9 MSEK från Vinnova för bolagets projekt inom behandling av covid-19 patienter med hög feber
-

 Marknadsnyheter3 år ago
Upptäck de bästa verktygen för att analysera Bitcoin!
-
Analys från DailyFX13 år ago
Japanese Yen Breakout or Fakeout? ZAR/JPY May Provide the Answer
-

 Marknadsnyheter3 år ago
Därför föredrar svenska spelare att spela via mobiltelefonen
-
Analys från DailyFX13 år ago
Price & Time: Key Levels to Watch in the Aftermath of NFP
-
Analys från DailyFX9 år ago
Gold Prices Falter at Resistance: Is the Bullish Run Finished?
-
 Nyheter8 år ago
Teknisk analys med Martin Hallström och Nils Brobacke