
Analys från DailyFX
GBP/USD Technical Analysis: Big Picture Support Holds, for Now
To receive James Stanley’s Analysis directly via email, please sign up here.
Talking Points:
- GBP/USD Technical Strategy: Long-term mixed, intermediate-term bearish, near-term bullish.
- Cable price action broke down to re-test a key area of support that had previously functioned as resistance.
- If you’re looking for trading ideas, check out our Trading Guides. They’re free and updated for Q1, 2017. If you’re looking for ideas more short-term in nature, please check out our IG Client Sentiment.
In our last article, we looked at the continued strength in GBP/USD as the pair finally tested above the 1.3000 psychological area of resistance. On the under-side of price action, a rather clear support zone had popped-up around the 1.2750 psychological level; and this syncs with prior range resistance from the post-Flash crash backdrop in Cable. As the U.K. is just a week away from general elections, anxiety has begun to show as polls are indicating that Theresa May’s conservatives may end up losing seats from the venture: And this can make for an even messier ‘Brexit negotiation,’ with the decision to host early elections back-firing on the newly installed PM. As sellers took over in Cable, support showed-up at a familiar area around 1.2750; and at least for now, buyers have held the pair above prior range resistance.

Chart prepared by James Stanley
While this bounce off of support may be attractive for continuation themes on longer-term time frames, the bigger question is one of short-term momentum. This recent bounce off of the support zone around 1.2750 has catapulted price action into the under-side of a previously bullish trend-line, which can be found by connecting the post-Breakout swing-low with the low from May 15th. This should give bulls or those utilizing short-term bullish strategies reason to pause as this resistance coincides with prior support; giving rise to the idea that we may be looking at either a) range-bound conditions or b) a corrective swing-lower.
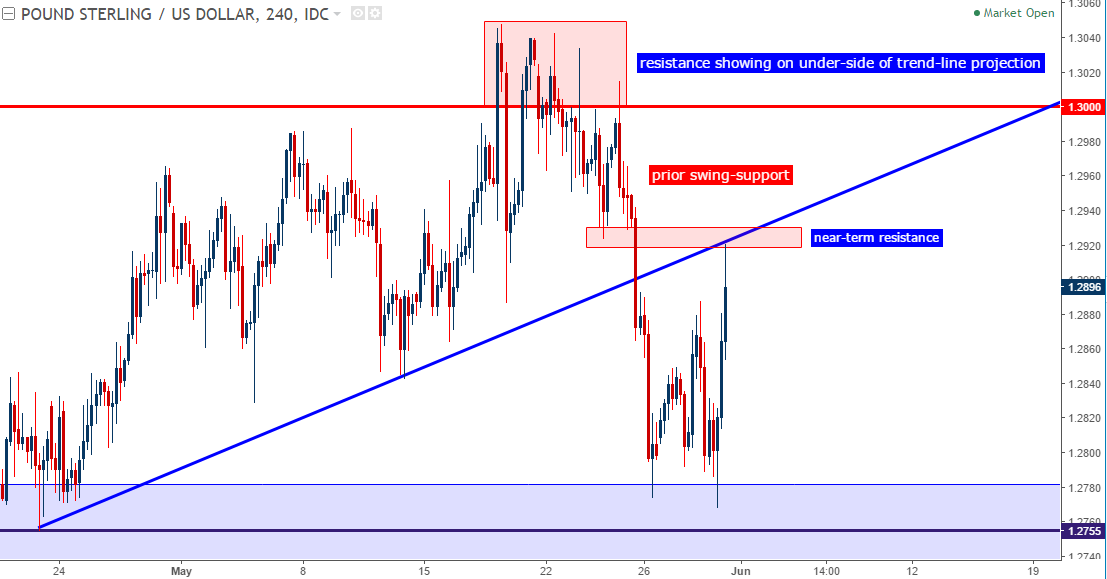
Chart prepared by James Stanley
For bullish approaches, or for those with a longer-term time horizon, waiting for a re-test of support could open the door to top-side swing strategies. The key here would be waiting for support to actually show around 1.2750-1.2775, as a 3rd test of a support zone usually brings diminishing marginal results unless something tangible has changed in the underlying conditions.
For those looking at shorter-term strategies, bearish reversals could be operable provided that risk is controlled. As we looked at in our last article, breaks-below the prior support level around 1.2825 could open the door to short-side setups, as bearish drive below these swing points illustrate waning bullish support that had previously driven cable to higher-highs and higher-lows. Taken with the near-term lower-low that printed earlier this morning, and those looking to execute short-term strategies could have a workable backdrop here in short Cable setups.

Chart prepared by James Stanley
— Written by James Stanley, Strategist for DailyFX.com
To receive James Stanley’s analysis directly via email, please SIGN UP HERE
Contact and follow James on Twitter: @JStanleyFX


What’s inside:
- EURUSD broke the ‘neckline’ of a bearish ‘head-and-shoulders’ pattern, April trend-line
- Resistance in vicinity of 11825/80 likely to keep a lid on further strength
- Targeting the low to mid-11600s with more selling
Confidence is essential to successful trading, see this new guide – ’Building Confidence in Trading’.
Coming into last week we pointed out the likelihood of finally seeing a resolution of the range EURUSD had been stuck in for the past few weeks, and one of the outcomes we made note of as a possibility was for the triggering of a ’head-and-shoulders’ pattern. Indeed, we saw a break of the ’neckline’ along with a drop below the April trend-line. This led to decent selling before a minor bounce took shape during the latter part of last week.
Looking ahead to next week the euro is set up for further losses as the path of least resistance has turned lower. Looking to a capper on any further strength there is resistance in the 11825-11880 area (old support becomes new resistance). As long as the euro stays below this area a downward bias will remain firmly intact.
Looking lower towards support eyes will be on the August low at 11662 and the 2016 high of 11616, of which the latter just happens to align almost precisely with the measured move target of the ‘head-and-shoulders’ pattern (determined by subtracting the height of the pattern from the neckline).
Bottom line: Shorts look set to have the upperhand as a fresh month gets underway as long as the euro remains capped by resistance. On weakness, we’ll be watching how the euro responds to a drop into support levels.
For a longer-term outlook on EURUSD, check out the just released Q4 Forecast.
EURUSD: Daily

—Written by Paul Robinson, Market Analyst
You can receive Paul’s analysis directly via email bysigning up here.
You can follow Paul on Twitter at@PaulRobinonFX.

Why and how do we use IG Client Sentiment in trading? See our guide and real-time data.
EURUSD: Retail trader data shows 37.3% of traders are net-long with the ratio of traders short to long at 1.68 to 1. In fact, traders have remained net-short since Apr 18 when EURUSD traded near 1.07831; price has moved 9.6% higher since then. The number of traders net-long is 15.4% lower than yesterday and 16.4% higher from last week, while the number of traders net-short is 0.4% higher than yesterday and 10.5% lower from last week.
We typically take a contrarian view to crowd sentiment, and the fact traders are net-short suggests EURUSD prices may continue to rise. Positioning is more net-short than yesterday but less net-short from last week. The combination of current sentiment and recent changes gives us a further mixed EURUSD trading bias.
— Written by Christopher Vecchio, CFA, Senior Currency Strategist
To contact Christopher Vecchio, e-mail cvecchio@dailyfx.com
Follow him on Twitter at @CVecchioFX
To be added to Christopher’s e-mail distribution list, please fill out this form

Why and how do we use IG Client Sentiment in trading? See our guide and real-time data.
GBPUSD: Retail trader data shows 38.2% of traders are net-long with the ratio of traders short to long at 1.62 to 1. In fact, traders have remained net-short since Sep 05 when GBPUSD traded near 1.29615; price has moved 3.4% higher since then. The number of traders net-long is 0.1% higher than yesterday and 13.4% higher from last week, while the number of traders net-short is 10.6% lower than yesterday and 18.3% lower from last week.
We typically take a contrarian view to crowd sentiment, and the fact traders are net-short suggests GBPUSD prices may continue to rise. Yet traders are less net-short than yesterday and compared with last week. Recent changes in sentiment warn that the current GBPUSD price trend may soon reverse lower despite the fact traders remain net-short.
— Written by Christopher Vecchio, CFA, Senior Currency Strategist
To contact Christopher Vecchio, e-mail cvecchio@dailyfx.com
Follow him on Twitter at @CVecchioFX
To be added to Christopher’s e-mail distribution list, please fill out this form
- Tightening fundamentals – bullish inventories from DOE
- Bombs to ”ceasefire” in hours – Brent below $70
- A muted price reaction. Market looks relaxed, but it is still on edge waiting for what Iran will do
- Very relaxed at USD 75/b. Risk barometer will likely fluctuate to higher levels with Brent into the 80ies or higher coming 2-3 weeks
- Brent needs to fall to USD 58/b to make cheating unprofitable for Kazakhstan
-
Analys från DailyFX10 år ago
EUR/USD Flirts with Monthly Close Under 30 Year Trendline
-

 Marknadsnyheter2 år ago
Upptäck de bästa verktygen för att analysera Bitcoin!
-
Marknadsnyheter5 år ago
BrainCool AB (publ): erhåller bidrag (grant) om 0,9 MSEK från Vinnova för bolagets projekt inom behandling av covid-19 patienter med hög feber
-
Analys från DailyFX12 år ago
Japanese Yen Breakout or Fakeout? ZAR/JPY May Provide the Answer
-

 Marknadsnyheter2 år ago
Därför föredrar svenska spelare att spela via mobiltelefonen
-
Analys från DailyFX12 år ago
Price & Time: Key Levels to Watch in the Aftermath of NFP
-
Analys från DailyFX8 år ago
Gold Prices Falter at Resistance: Is the Bullish Run Finished?
-
 Nyheter7 år ago
Teknisk analys med Martin Hallström och Nils Brobacke