
Analys från DailyFX
Gold Prices Bounce Higher with an Eye Towards $1260
Gold prices bounced higher off the 78.6% retracement level near $1215 on May 9. Continued strength from this bounce may push gold prices up towards $1260.
We identified in Gold Prices Find Support and analyzed that the down trend was limited and that the up trend appeared to be incomplete. This implies that we are likely to see a new high above $1300 prior to see a new low below $1122.
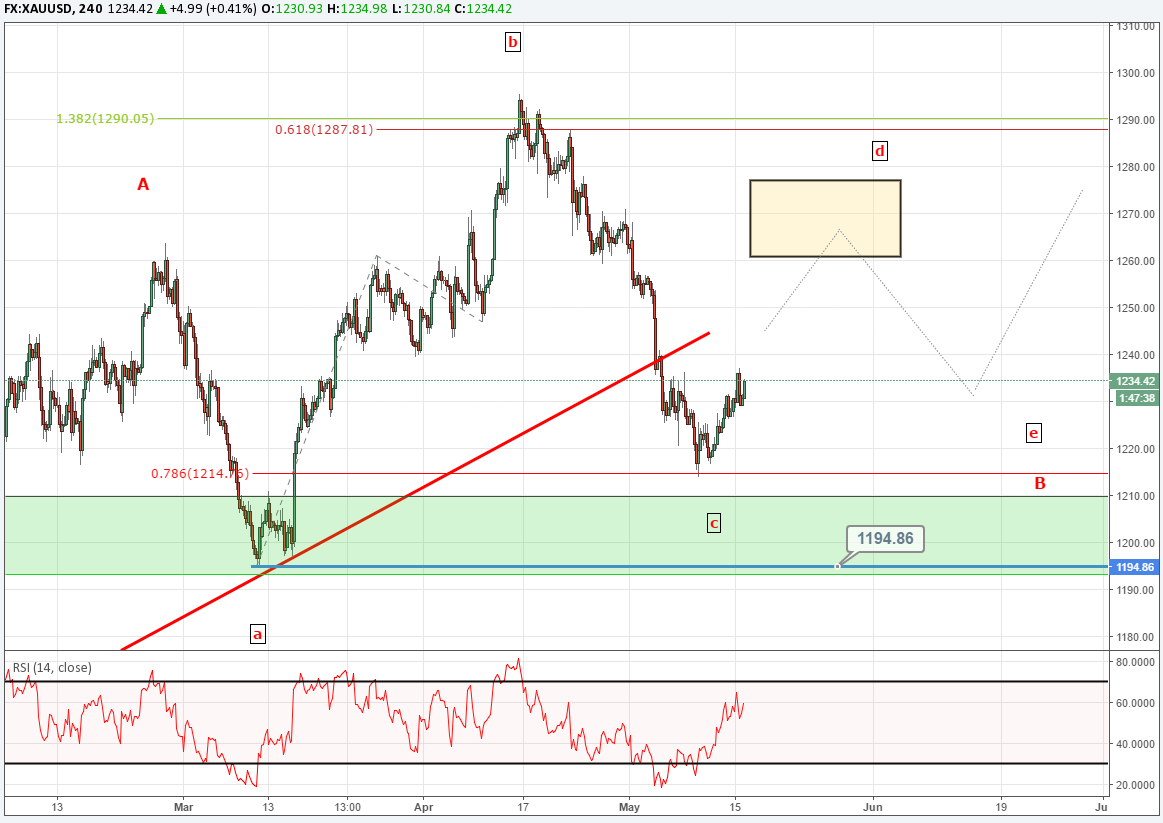
Using Elliott Wave theory as a model, it appears gold prices are still stuck in a large ‘B’ wave pattern. The bounce from $1215 leans the pattern towards a ‘B’ wave triangle. If that is the case, we may have just finished the middle portion of the triangle with a few more weeks of sideways chop to go between $1195 and $1295. Once the ‘d’ and ‘e’ legs of the triangle are complete, then a larger bullish opportunity exists using the ‘c’ wave low as risk.
The model suggests that if the ‘d’ leg is underway, look for gold prices to move higher towards $1260 and possibly to $1280. We anticipate that prices would hold below $1295 before another pull back begins.
Fed fund futures continue to price in a rate hike during the June meeting. However, an additional hike for December 2017 does appear to be pushed back into 2018. Read our Q2 Gold forecast and see how interest rate hikes may affect gold prices.
The IG Client sentiment reading for gold is at +5.61. This reading suggests the vast majority of retail traders are net long and the market is at risk of a pull back. Follow this live reading and learn how to trade with sentiment at this link. If the market pulls back and if $1195 level does break, the triangle pattern is negated and we shift towards the previously mentioned flat pattern (right side in the picture from the previous article).
—Written by Jeremy Wagner, CEWA-M
Discuss this market with Jeremy in Monday’s US Opening Bell webinar.
Follow on twitter @JWagnerFXTrader .
Join Jeremy’s distribution list.
Read the recent EUR/USD Elliott Wave article.
Read the recent GBP/USD Elliott Wave article.
Read the recent USD/CAD Elliott Wave article.


What’s inside:
- EURUSD broke the ‘neckline’ of a bearish ‘head-and-shoulders’ pattern, April trend-line
- Resistance in vicinity of 11825/80 likely to keep a lid on further strength
- Targeting the low to mid-11600s with more selling
Confidence is essential to successful trading, see this new guide – ’Building Confidence in Trading’.
Coming into last week we pointed out the likelihood of finally seeing a resolution of the range EURUSD had been stuck in for the past few weeks, and one of the outcomes we made note of as a possibility was for the triggering of a ’head-and-shoulders’ pattern. Indeed, we saw a break of the ’neckline’ along with a drop below the April trend-line. This led to decent selling before a minor bounce took shape during the latter part of last week.
Looking ahead to next week the euro is set up for further losses as the path of least resistance has turned lower. Looking to a capper on any further strength there is resistance in the 11825-11880 area (old support becomes new resistance). As long as the euro stays below this area a downward bias will remain firmly intact.
Looking lower towards support eyes will be on the August low at 11662 and the 2016 high of 11616, of which the latter just happens to align almost precisely with the measured move target of the ‘head-and-shoulders’ pattern (determined by subtracting the height of the pattern from the neckline).
Bottom line: Shorts look set to have the upperhand as a fresh month gets underway as long as the euro remains capped by resistance. On weakness, we’ll be watching how the euro responds to a drop into support levels.
For a longer-term outlook on EURUSD, check out the just released Q4 Forecast.
EURUSD: Daily

—Written by Paul Robinson, Market Analyst
You can receive Paul’s analysis directly via email bysigning up here.
You can follow Paul on Twitter at@PaulRobinonFX.

Why and how do we use IG Client Sentiment in trading? See our guide and real-time data.
EURUSD: Retail trader data shows 37.3% of traders are net-long with the ratio of traders short to long at 1.68 to 1. In fact, traders have remained net-short since Apr 18 when EURUSD traded near 1.07831; price has moved 9.6% higher since then. The number of traders net-long is 15.4% lower than yesterday and 16.4% higher from last week, while the number of traders net-short is 0.4% higher than yesterday and 10.5% lower from last week.
We typically take a contrarian view to crowd sentiment, and the fact traders are net-short suggests EURUSD prices may continue to rise. Positioning is more net-short than yesterday but less net-short from last week. The combination of current sentiment and recent changes gives us a further mixed EURUSD trading bias.
— Written by Christopher Vecchio, CFA, Senior Currency Strategist
To contact Christopher Vecchio, e-mail cvecchio@dailyfx.com
Follow him on Twitter at @CVecchioFX
To be added to Christopher’s e-mail distribution list, please fill out this form

Why and how do we use IG Client Sentiment in trading? See our guide and real-time data.
GBPUSD: Retail trader data shows 38.2% of traders are net-long with the ratio of traders short to long at 1.62 to 1. In fact, traders have remained net-short since Sep 05 when GBPUSD traded near 1.29615; price has moved 3.4% higher since then. The number of traders net-long is 0.1% higher than yesterday and 13.4% higher from last week, while the number of traders net-short is 10.6% lower than yesterday and 18.3% lower from last week.
We typically take a contrarian view to crowd sentiment, and the fact traders are net-short suggests GBPUSD prices may continue to rise. Yet traders are less net-short than yesterday and compared with last week. Recent changes in sentiment warn that the current GBPUSD price trend may soon reverse lower despite the fact traders remain net-short.
— Written by Christopher Vecchio, CFA, Senior Currency Strategist
To contact Christopher Vecchio, e-mail cvecchio@dailyfx.com
Follow him on Twitter at @CVecchioFX
To be added to Christopher’s e-mail distribution list, please fill out this form
- Brent crude up USD 9/bl on the week… ”deal around the corner” narrative fades
- Market Still Betting on Timely Resolution, But Each Day Raises Shortage Risk
- TACO (or Whatever It Was) Sends Oil Lower — Iran Keeps Choking Hormuz
- Oil stress is rising as the supply chains and buffers are drained
- Buy Brent Dec-2026 calls with strike $150/b!
-
Analys från DailyFX10 år ago
EUR/USD Flirts with Monthly Close Under 30 Year Trendline
-
Marknadsnyheter6 år ago
BrainCool AB (publ): erhåller bidrag (grant) om 0,9 MSEK från Vinnova för bolagets projekt inom behandling av covid-19 patienter med hög feber
-

 Marknadsnyheter3 år ago
Upptäck de bästa verktygen för att analysera Bitcoin!
-
Analys från DailyFX13 år ago
Japanese Yen Breakout or Fakeout? ZAR/JPY May Provide the Answer
-

 Marknadsnyheter3 år ago
Därför föredrar svenska spelare att spela via mobiltelefonen
-
Analys från DailyFX13 år ago
Price & Time: Key Levels to Watch in the Aftermath of NFP
-
Analys från DailyFX9 år ago
Gold Prices Falter at Resistance: Is the Bullish Run Finished?
-
 Nyheter7 år ago
Teknisk analys med Martin Hallström och Nils Brobacke