
Analys från DailyFX
Gold Prices Bounce Off of Fib Support After Falling Below Bullish Channel
Talking Points:
– Gold Technical Strategy: Longer-term bearish, intermediate-term bullish, short-term mixed.
– Gold prices caught support off of a key Fib level, but sellers have yet to relent.
– If you’re looking for trading ideas, check out our Trading Guides. And if you’re looking for ideas that are more short-term in nature, please check out our IG Client Sentiment Indicator.
To receive James Stanley’s analysis directly via email, please SIGN UP HERE
In our last article, we looked at the recent up-trend in Gold prices running within a fairly consistent bullish trend channel. But this was just a part of the story, as the backdrop in Gold prices ahead of that bullish run was considerably bearish after price action had driven from a high above $1,295 down to a new low below $1,215.
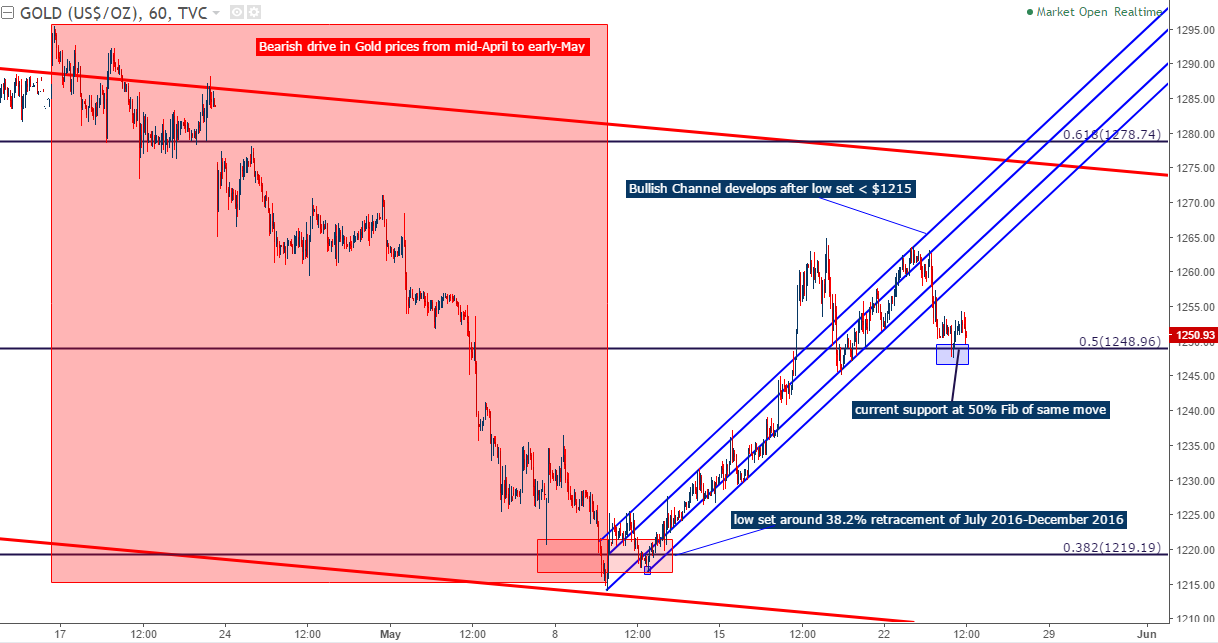
Chart prepared by James Stanley
Even the bearish move above needs to be taken in context, as this was coming fresh on the heels of another ‘rate hike rally’ that likely had some additional bullish drive on the basis of risk aversion. After the Fed hiked rates in December, Gold prices set a low around $1,122 before going on to rally for the next two months. Prices pulled back in the first half of March as the Federal Reserve furnished a plethora of warnings about impending rate hikes; but after rates were actually hiked, Gold prices set another ‘higher-low’ before going on to rally for another month. This brought upon a test of a key trend-line that can be found by connecting the July high to the election night spike in Gold prices.
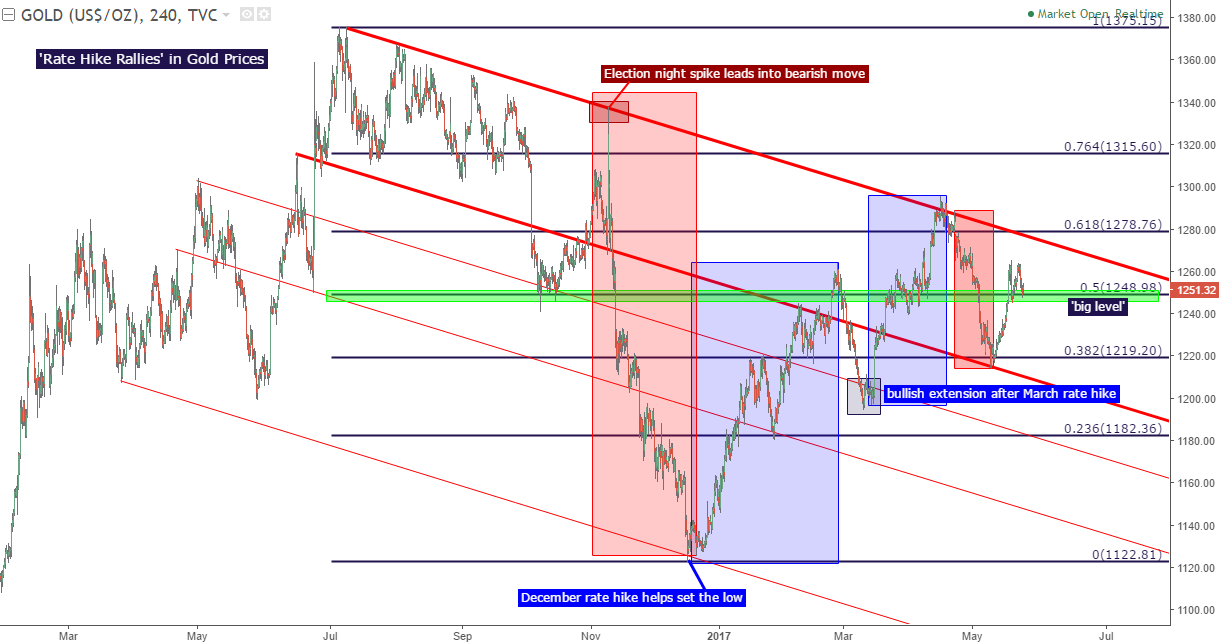
Chart prepared by James Stanley
The two above themes put Gold prices in a fairly precarious position at the moment. The longer-term formation is still bearish, but near-term, there are still some bullish tendencies here as support continues to show around the 50% Fibonacci retracement of that most recent major move. So, for those looking to trade shorter-term strategies, the bullish side would likely be most attractive using the support that came-in around the 50% retracement as a basis for risk placement. And for those that want to treat the bullish side with a bit more caution, adding a Fibonacci retracement on the most recent bearish move lower, from the $1,295-high down to the $1,214-low, can help to time the setup. The 50% retracement of that shorter-term move comes in at $1,254.80; and if prices can re-cross above this level, the prospect of bullish continuation will look considerably more attractive.
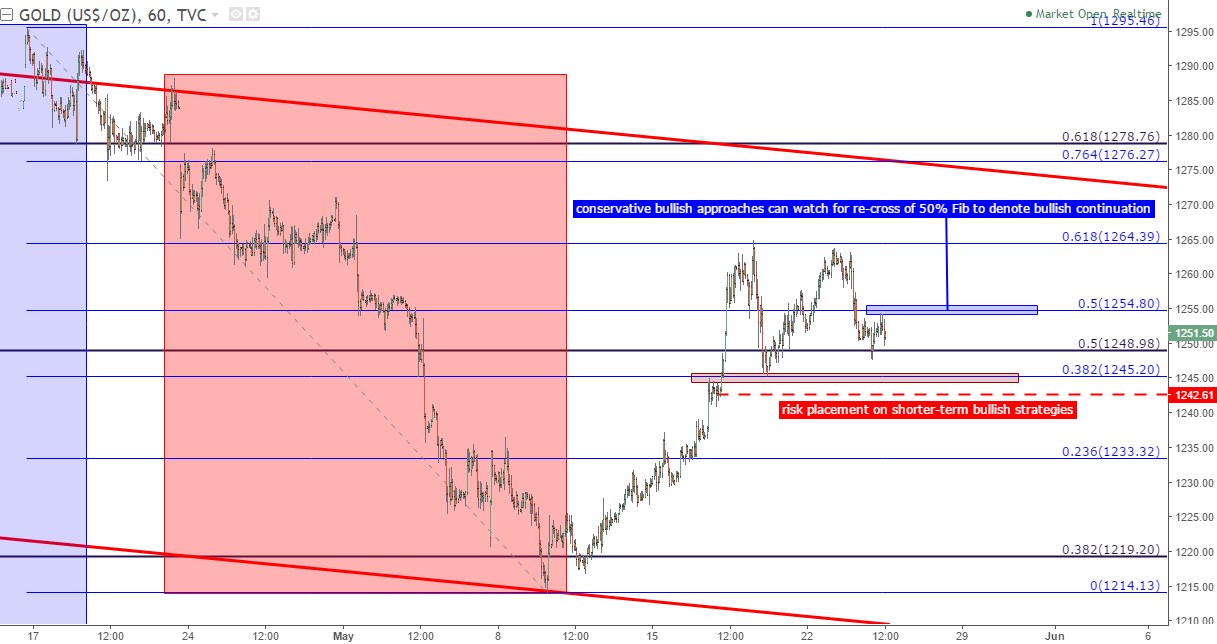
Chart prepared by James Stanley
Alternatively, longer time frames will likely want to avoid the bullish side, at least for now, as price action was unable to set a higher-high when re-testing $1,264. After support came-in around $1,249 earlier this morning, bulls were able to drive prices-higher; but sellers re-emerged just shy of the 50% Fib retracement of the shorter-term bearish move. This gives the appearance that sellers were merely using this morning’s support bounce to further position-in to bearish setups; and this further adds proof to the idea that we may be near another turn in Gold prices.
On the bearish side, there are a couple of ways that traders could move forward with current levels. A break below $1,245.20 would give us a ‘lower swing low’, and this could highlight the prospect of bearish continuation. If a fresh low prints, current support around $1,249 could be re-assigned as ‘lower-high’ resistance in the effort of bearish continuation. The second method would be to wait for another re-test of swing-high resistance around $1,254. Another re-test of this zone coupled with a short-term ‘lower-high’ could open the door to short-side swing setups.
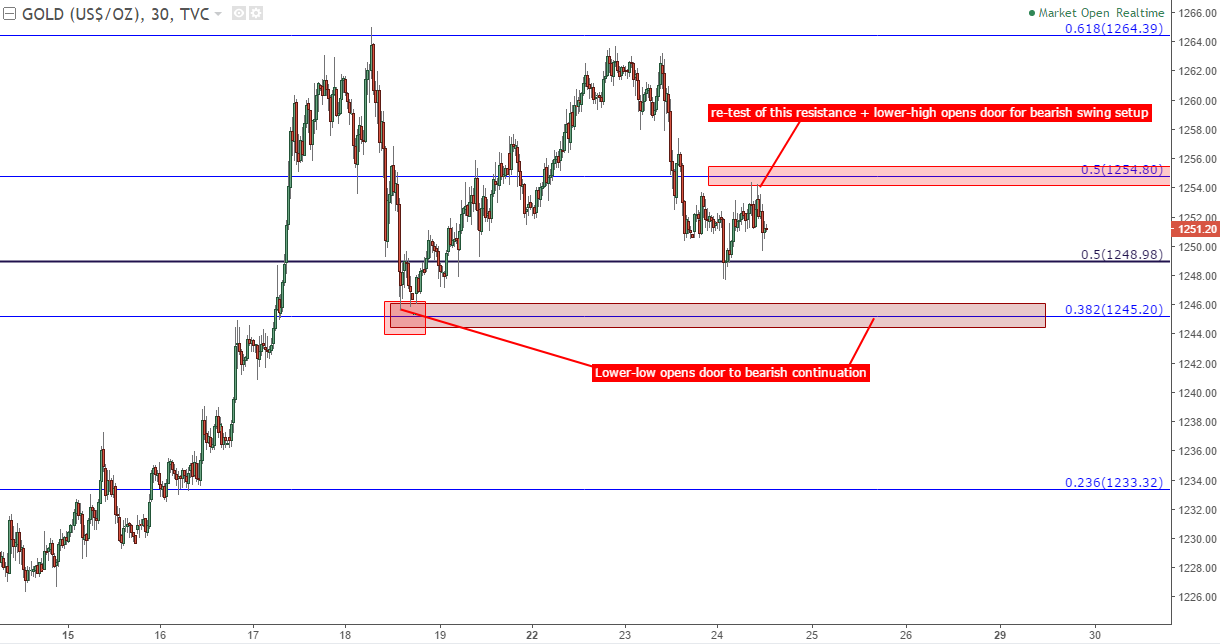
Chart prepared by James Stanley
— Written by James Stanley, Strategist for DailyFX.com
To receive James Stanley’s analysis directly via email, please SIGN UP HERE
Contact and follow James on Twitter: @JStanleyFX


What’s inside:
- EURUSD broke the ‘neckline’ of a bearish ‘head-and-shoulders’ pattern, April trend-line
- Resistance in vicinity of 11825/80 likely to keep a lid on further strength
- Targeting the low to mid-11600s with more selling
Confidence is essential to successful trading, see this new guide – ’Building Confidence in Trading’.
Coming into last week we pointed out the likelihood of finally seeing a resolution of the range EURUSD had been stuck in for the past few weeks, and one of the outcomes we made note of as a possibility was for the triggering of a ’head-and-shoulders’ pattern. Indeed, we saw a break of the ’neckline’ along with a drop below the April trend-line. This led to decent selling before a minor bounce took shape during the latter part of last week.
Looking ahead to next week the euro is set up for further losses as the path of least resistance has turned lower. Looking to a capper on any further strength there is resistance in the 11825-11880 area (old support becomes new resistance). As long as the euro stays below this area a downward bias will remain firmly intact.
Looking lower towards support eyes will be on the August low at 11662 and the 2016 high of 11616, of which the latter just happens to align almost precisely with the measured move target of the ‘head-and-shoulders’ pattern (determined by subtracting the height of the pattern from the neckline).
Bottom line: Shorts look set to have the upperhand as a fresh month gets underway as long as the euro remains capped by resistance. On weakness, we’ll be watching how the euro responds to a drop into support levels.
For a longer-term outlook on EURUSD, check out the just released Q4 Forecast.
EURUSD: Daily

—Written by Paul Robinson, Market Analyst
You can receive Paul’s analysis directly via email bysigning up here.
You can follow Paul on Twitter at@PaulRobinonFX.

Why and how do we use IG Client Sentiment in trading? See our guide and real-time data.
EURUSD: Retail trader data shows 37.3% of traders are net-long with the ratio of traders short to long at 1.68 to 1. In fact, traders have remained net-short since Apr 18 when EURUSD traded near 1.07831; price has moved 9.6% higher since then. The number of traders net-long is 15.4% lower than yesterday and 16.4% higher from last week, while the number of traders net-short is 0.4% higher than yesterday and 10.5% lower from last week.
We typically take a contrarian view to crowd sentiment, and the fact traders are net-short suggests EURUSD prices may continue to rise. Positioning is more net-short than yesterday but less net-short from last week. The combination of current sentiment and recent changes gives us a further mixed EURUSD trading bias.
— Written by Christopher Vecchio, CFA, Senior Currency Strategist
To contact Christopher Vecchio, e-mail cvecchio@dailyfx.com
Follow him on Twitter at @CVecchioFX
To be added to Christopher’s e-mail distribution list, please fill out this form

Why and how do we use IG Client Sentiment in trading? See our guide and real-time data.
GBPUSD: Retail trader data shows 38.2% of traders are net-long with the ratio of traders short to long at 1.62 to 1. In fact, traders have remained net-short since Sep 05 when GBPUSD traded near 1.29615; price has moved 3.4% higher since then. The number of traders net-long is 0.1% higher than yesterday and 13.4% higher from last week, while the number of traders net-short is 10.6% lower than yesterday and 18.3% lower from last week.
We typically take a contrarian view to crowd sentiment, and the fact traders are net-short suggests GBPUSD prices may continue to rise. Yet traders are less net-short than yesterday and compared with last week. Recent changes in sentiment warn that the current GBPUSD price trend may soon reverse lower despite the fact traders remain net-short.
— Written by Christopher Vecchio, CFA, Senior Currency Strategist
To contact Christopher Vecchio, e-mail cvecchio@dailyfx.com
Follow him on Twitter at @CVecchioFX
To be added to Christopher’s e-mail distribution list, please fill out this form
- Whipping quota cheaters into line is still the most likely explanation
- June OPEC+ quota: Another triple increase or sticking to plan with +137 kb/d increase?
- Unusual strong bearish market conviction but OPEC+ market strategy is always a wildcard
- Oil demand at risk as US consumers soon will face hard tariff-realities
- Brent crude is now trading below its nominal 2018-19 average in EUR/barrel terms
-
Analys från DailyFX9 år ago
EUR/USD Flirts with Monthly Close Under 30 Year Trendline
-

 Marknadsnyheter2 år ago
Upptäck de bästa verktygen för att analysera Bitcoin!
-
Marknadsnyheter5 år ago
BrainCool AB (publ): erhåller bidrag (grant) om 0,9 MSEK från Vinnova för bolagets projekt inom behandling av covid-19 patienter med hög feber
-
Analys från DailyFX12 år ago
Japanese Yen Breakout or Fakeout? ZAR/JPY May Provide the Answer
-

 Marknadsnyheter2 år ago
Därför föredrar svenska spelare att spela via mobiltelefonen
-
Analys från DailyFX12 år ago
Price & Time: Key Levels to Watch in the Aftermath of NFP
-
Analys från DailyFX8 år ago
Gold Prices Falter at Resistance: Is the Bullish Run Finished?
-
 Nyheter6 år ago
Teknisk analys med Martin Hallström och Nils Brobacke