
Analys från DailyFX
Gold Prices Break-Higher, Bullish Channel as Next Support?
Talking Points:
– Gold prices have hastened the bullish advance, posing a topside break of the bullish trend channel we looked at on Monday.
– Near-term price action in Gold prices is definitely bullish; but a longer-term bearish channel persists.
– If you’re looking for trading ideas, check out our Trading Guides. They’re free and updated for Q1, 2017. If you’re looking for ideas more short-term in nature, please check out our IG Client Sentiment.
To receive James Stanley’s Analysis directly via email, please sign up here.
In our last article, we looked at the bullish channel that had begun to build with near-term price action in Gold prices. But given the veracity of the prior move-lower, that up-ward sloping channel took on the appearance of a bear-flag that could have down-side continuation potential provided that some element of resistance showed up.
Since then, not much resistance has shown: Buyers have rampantly pushed prices beyond any potential resistance levels with a minimum of pullback, and now short-term price action has burst above the bullish trend channel as the move has recently become rather one-sided.
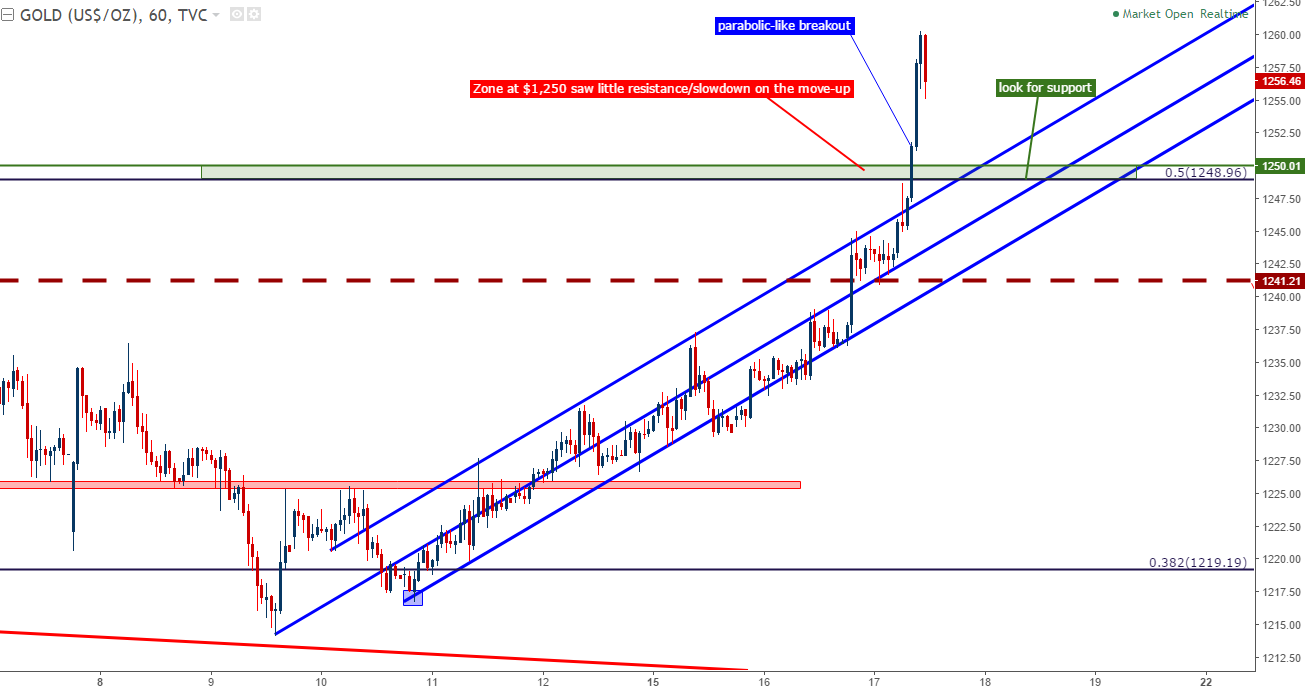
Chart prepared by James Stanley
The swing-low from last week developed at an interesting area – around the 38.2% of the prior major move, taking the July 2016 high down to the December low. This zone is confluent with a trend-line as part of a bearish channel over the same period of time.
The momentum in this move is very similar to what was seen in the post-rate hike backdrop over the past seven months. After the Fed hiked rates in December, Gold prices went on a bullish rampage for the next two-and-a-half months. Then in early-March, that up-trend cooled as the Fed talked up the prospect of a March rate hike. But after that March rate hike, Gold prices were free to fly again, as bulls took over to push prices up to the $1,295 area. In mid-April, and hastened by the results from the first round of French elections, weakness began to show again in Gold prices until last week’s low came in. So, while near-term momentum is decidedly bullish, the intermediate-term formation here would still be bearish in nature, and this would remain as such until we either a) post a topside break out of the bearish channel or b) take out the prior swing-high at $1,295 (this would offer additional confirmation as a $1,295 print would necessitate a bullish channel break).
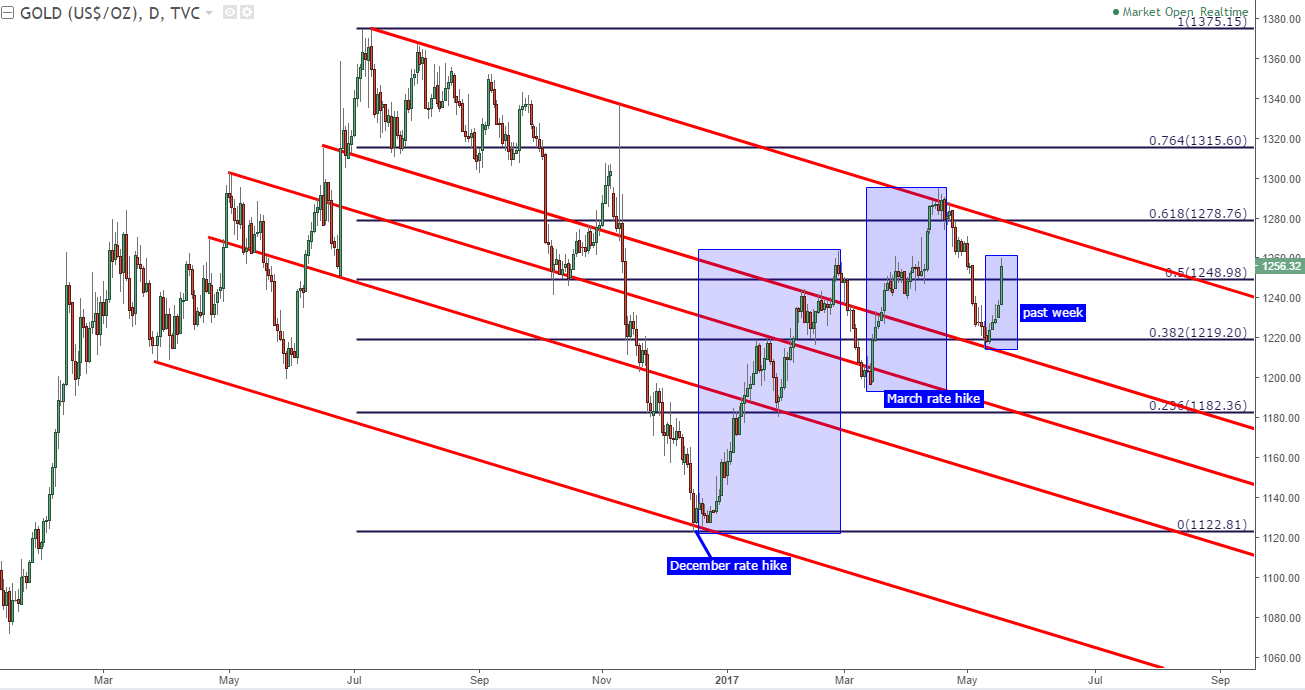
Chart prepared by James Stanley
The counter-active nature of short and long-term setups would allow traders to utilize their USD-biases for positioning into trades. For those that do want to look for continued USD-weakness, the short-term formation should be the focus of those efforts, and traders would likely want to wait for an element of support to show so that risk levels could be properly allocated.
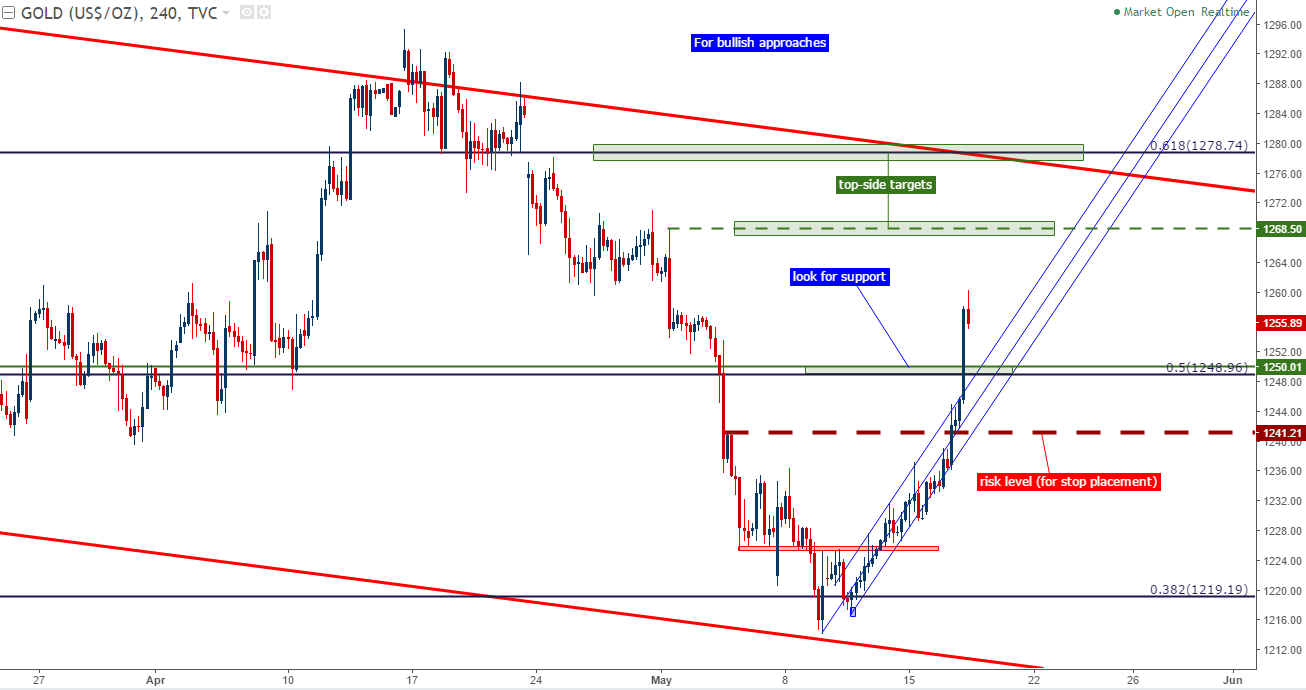
Chart prepared by James Stanley
For bearish approaches, traders would likely want to take heed to the degree of strength that’s shown in this bullish burst-higher in Gold prices. This isn’t the type of price action that traders should want to directly fade, at least without some type of additional thesis. But resistance levels looming above current prices could open the door to reversal plays should sellers actually show up. On the chart below, we’re looking at three different areas where this could potentially play out, and these levels are all taken from prior price action. The third zone of resistance comprises an approximate $2 range from $1,276.55-$1,278.76.
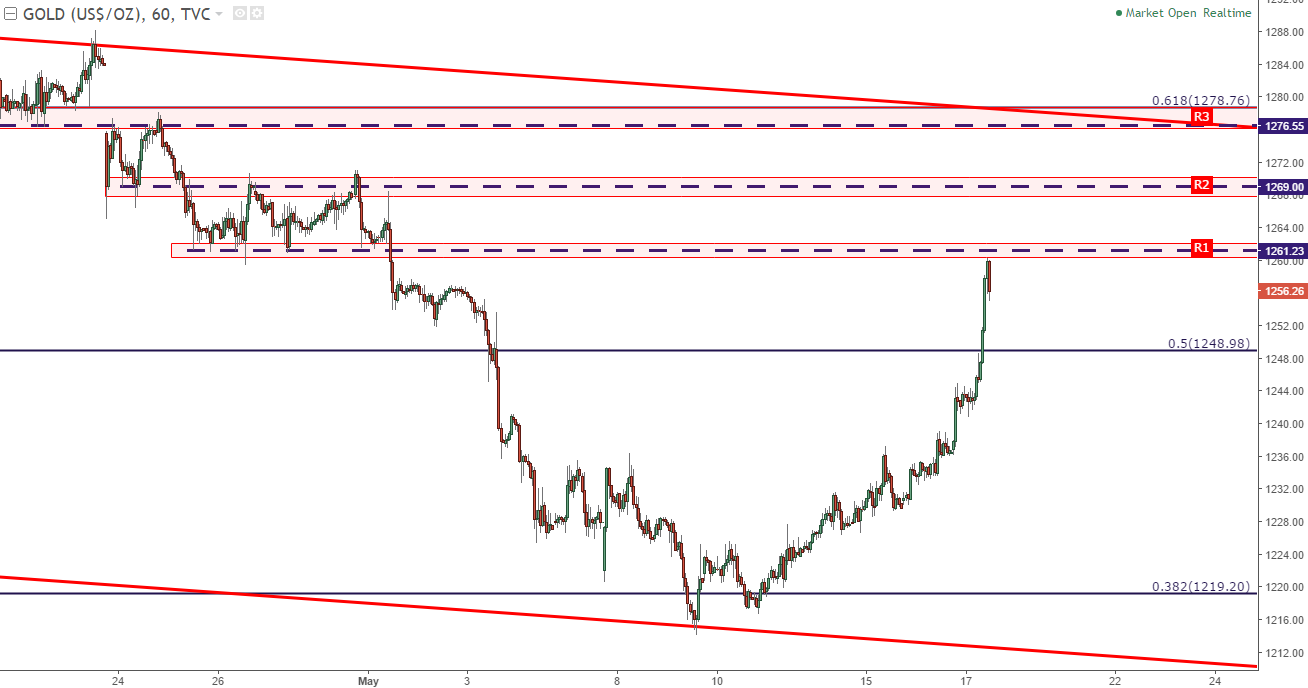
Chart prepared by James Stanley
— Written by James Stanley, Strategist for DailyFX.com
To receive James Stanley’s analysis directly via email, please SIGN UP HERE
Contact and follow James on Twitter: @JStanleyFX


What’s inside:
- EURUSD broke the ‘neckline’ of a bearish ‘head-and-shoulders’ pattern, April trend-line
- Resistance in vicinity of 11825/80 likely to keep a lid on further strength
- Targeting the low to mid-11600s with more selling
Confidence is essential to successful trading, see this new guide – ’Building Confidence in Trading’.
Coming into last week we pointed out the likelihood of finally seeing a resolution of the range EURUSD had been stuck in for the past few weeks, and one of the outcomes we made note of as a possibility was for the triggering of a ’head-and-shoulders’ pattern. Indeed, we saw a break of the ’neckline’ along with a drop below the April trend-line. This led to decent selling before a minor bounce took shape during the latter part of last week.
Looking ahead to next week the euro is set up for further losses as the path of least resistance has turned lower. Looking to a capper on any further strength there is resistance in the 11825-11880 area (old support becomes new resistance). As long as the euro stays below this area a downward bias will remain firmly intact.
Looking lower towards support eyes will be on the August low at 11662 and the 2016 high of 11616, of which the latter just happens to align almost precisely with the measured move target of the ‘head-and-shoulders’ pattern (determined by subtracting the height of the pattern from the neckline).
Bottom line: Shorts look set to have the upperhand as a fresh month gets underway as long as the euro remains capped by resistance. On weakness, we’ll be watching how the euro responds to a drop into support levels.
For a longer-term outlook on EURUSD, check out the just released Q4 Forecast.
EURUSD: Daily

—Written by Paul Robinson, Market Analyst
You can receive Paul’s analysis directly via email bysigning up here.
You can follow Paul on Twitter at@PaulRobinonFX.

Why and how do we use IG Client Sentiment in trading? See our guide and real-time data.
EURUSD: Retail trader data shows 37.3% of traders are net-long with the ratio of traders short to long at 1.68 to 1. In fact, traders have remained net-short since Apr 18 when EURUSD traded near 1.07831; price has moved 9.6% higher since then. The number of traders net-long is 15.4% lower than yesterday and 16.4% higher from last week, while the number of traders net-short is 0.4% higher than yesterday and 10.5% lower from last week.
We typically take a contrarian view to crowd sentiment, and the fact traders are net-short suggests EURUSD prices may continue to rise. Positioning is more net-short than yesterday but less net-short from last week. The combination of current sentiment and recent changes gives us a further mixed EURUSD trading bias.
— Written by Christopher Vecchio, CFA, Senior Currency Strategist
To contact Christopher Vecchio, e-mail cvecchio@dailyfx.com
Follow him on Twitter at @CVecchioFX
To be added to Christopher’s e-mail distribution list, please fill out this form

Why and how do we use IG Client Sentiment in trading? See our guide and real-time data.
GBPUSD: Retail trader data shows 38.2% of traders are net-long with the ratio of traders short to long at 1.62 to 1. In fact, traders have remained net-short since Sep 05 when GBPUSD traded near 1.29615; price has moved 3.4% higher since then. The number of traders net-long is 0.1% higher than yesterday and 13.4% higher from last week, while the number of traders net-short is 10.6% lower than yesterday and 18.3% lower from last week.
We typically take a contrarian view to crowd sentiment, and the fact traders are net-short suggests GBPUSD prices may continue to rise. Yet traders are less net-short than yesterday and compared with last week. Recent changes in sentiment warn that the current GBPUSD price trend may soon reverse lower despite the fact traders remain net-short.
— Written by Christopher Vecchio, CFA, Senior Currency Strategist
To contact Christopher Vecchio, e-mail cvecchio@dailyfx.com
Follow him on Twitter at @CVecchioFX
To be added to Christopher’s e-mail distribution list, please fill out this form
- Crude oil comment: Not so fragile yet. If it was it would have sold off more yesterday
- OPEC+ can probably stomach a flat to slight contango market during a period where they lift production
- Oversold. Rising 1-3mth time-spreads. Possibly rebounding to USD 73.5/b before downside ensues
- A deliberate measure to push oil price lower but it is not the opening of the floodgates
- Brent whacked down yet again by negative Trump-fallout
-
Analys från DailyFX9 år ago
EUR/USD Flirts with Monthly Close Under 30 Year Trendline
-

 Marknadsnyheter2 år ago
Upptäck de bästa verktygen för att analysera Bitcoin!
-
Marknadsnyheter5 år ago
BrainCool AB (publ): erhåller bidrag (grant) om 0,9 MSEK från Vinnova för bolagets projekt inom behandling av covid-19 patienter med hög feber
-
Analys från DailyFX12 år ago
Japanese Yen Breakout or Fakeout? ZAR/JPY May Provide the Answer
-
Analys från DailyFX12 år ago
Price & Time: Key Levels to Watch in the Aftermath of NFP
-

 Marknadsnyheter2 år ago
Därför föredrar svenska spelare att spela via mobiltelefonen
-
Analys från DailyFX7 år ago
Gold Prices Falter at Resistance: Is the Bullish Run Finished?
-
 Nyheter6 år ago
Teknisk analys med Martin Hallström och Nils Brobacke