
Analys från DailyFX
Japanese Yen Technical Analysis: Watch Trendline Support Closely
Talking Points:
- USDJPY made a new 2017 low then almost immediately set off to post a ‘higher high’
- This rather confusing process has yet to be resolved
- The pair remains above trendline support, too, but only just
Join us and join in. Trade all the major Asia Pacific economic data live and interactive at the DailyFX webinars
The Japanese Yen’s daily chart against the Dollar is a little ambiguous right now.
USD/JPY posted a new low for 2017 back on September 8 but then proceeded to gain quite strongly to the point on Thursday of this week when it posted a ‘higher high’ in short order. The 110.99 point reached then is above the 110.63 peak scaled on August 31.
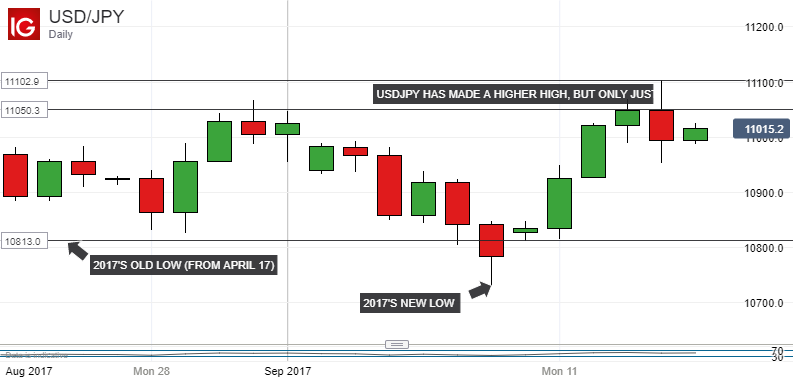
The question for investors now is whether the pair will indeed confirm this high and slink back again toward the year’s lows, or build a higher base around current levels. It’s impossible to be sure, of course. But if we pick apart USD/JPY’s latest burst of vigor we see that four straight days of gains into Wednesday of this week coincided with a global pickup in risk appetite which seems now to be a little exhausted. However, it’s tempting to conclude that was a one-off, perhaps even rather spurious reason for the pair’s altitude and that, had it not occurred we would have seen yet another lower low this week.
That said USD/JPY remains above trendline support stemming from its 2017 peak of 114.27 on July 11. This is not insignificant as the pair has spent precious little time anywhere near the top of this trendline, never mind above it, in the intervening months.
If you’re are uncommitted it might pay to wait now and see whether we get a daily close above the line. If we do there may be some chance that USD/JPY is building at least a new range base around current levels, with its upper reaches yet to be defined. However, if we don’t, then it seems likely that the range between the year’s lows in the 107 area and highs in the mid-110s are still the band you have to trade with.
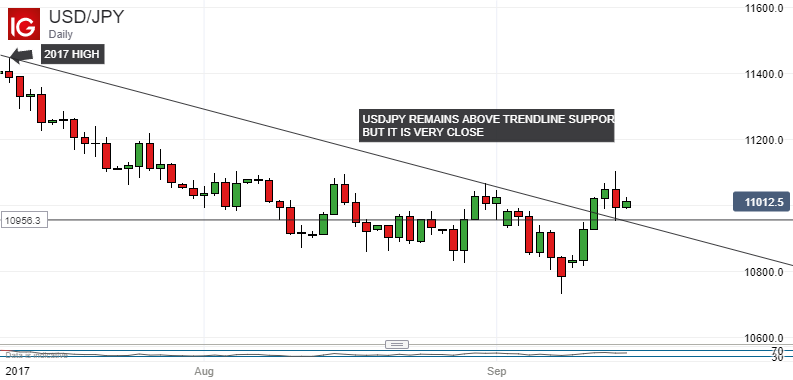
That trendline support now comes in arounds 109.48.
The generally reinvigorated British Pound, meanwhile, has made considerable headway against the Japanese Yen and, indeed, has posted a new 2017 high of 148.35 just this week.
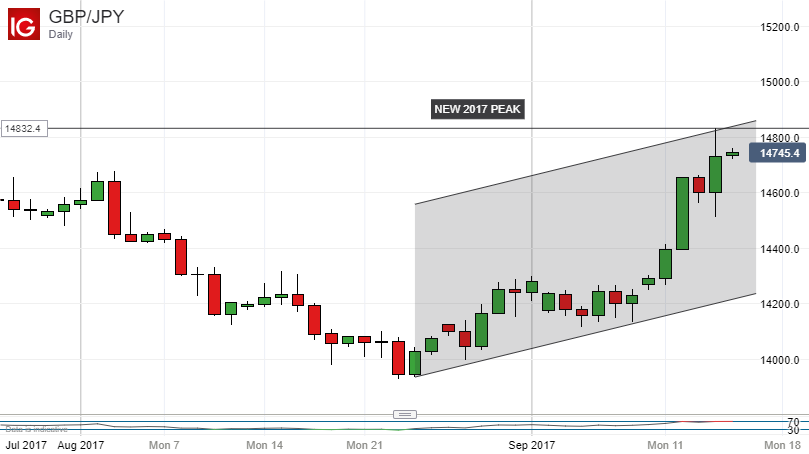
For the moment, GBP/JPY looks exceedingly comfortable within an uptrend channel from its late-August lows. However, it is also looking extremely overbought, unsurprisingly and a period of some consolidation must now be at least likely, even if the cross doesn’t retrace very far.
— Written by David Cottle, DailyFX Research
Contact and follow David on Twitter:@DavidCottleFX


What’s inside:
- EURUSD broke the ‘neckline’ of a bearish ‘head-and-shoulders’ pattern, April trend-line
- Resistance in vicinity of 11825/80 likely to keep a lid on further strength
- Targeting the low to mid-11600s with more selling
Confidence is essential to successful trading, see this new guide – ’Building Confidence in Trading’.
Coming into last week we pointed out the likelihood of finally seeing a resolution of the range EURUSD had been stuck in for the past few weeks, and one of the outcomes we made note of as a possibility was for the triggering of a ’head-and-shoulders’ pattern. Indeed, we saw a break of the ’neckline’ along with a drop below the April trend-line. This led to decent selling before a minor bounce took shape during the latter part of last week.
Looking ahead to next week the euro is set up for further losses as the path of least resistance has turned lower. Looking to a capper on any further strength there is resistance in the 11825-11880 area (old support becomes new resistance). As long as the euro stays below this area a downward bias will remain firmly intact.
Looking lower towards support eyes will be on the August low at 11662 and the 2016 high of 11616, of which the latter just happens to align almost precisely with the measured move target of the ‘head-and-shoulders’ pattern (determined by subtracting the height of the pattern from the neckline).
Bottom line: Shorts look set to have the upperhand as a fresh month gets underway as long as the euro remains capped by resistance. On weakness, we’ll be watching how the euro responds to a drop into support levels.
For a longer-term outlook on EURUSD, check out the just released Q4 Forecast.
EURUSD: Daily

—Written by Paul Robinson, Market Analyst
You can receive Paul’s analysis directly via email bysigning up here.
You can follow Paul on Twitter at@PaulRobinonFX.

Why and how do we use IG Client Sentiment in trading? See our guide and real-time data.
EURUSD: Retail trader data shows 37.3% of traders are net-long with the ratio of traders short to long at 1.68 to 1. In fact, traders have remained net-short since Apr 18 when EURUSD traded near 1.07831; price has moved 9.6% higher since then. The number of traders net-long is 15.4% lower than yesterday and 16.4% higher from last week, while the number of traders net-short is 0.4% higher than yesterday and 10.5% lower from last week.
We typically take a contrarian view to crowd sentiment, and the fact traders are net-short suggests EURUSD prices may continue to rise. Positioning is more net-short than yesterday but less net-short from last week. The combination of current sentiment and recent changes gives us a further mixed EURUSD trading bias.
— Written by Christopher Vecchio, CFA, Senior Currency Strategist
To contact Christopher Vecchio, e-mail cvecchio@dailyfx.com
Follow him on Twitter at @CVecchioFX
To be added to Christopher’s e-mail distribution list, please fill out this form

Why and how do we use IG Client Sentiment in trading? See our guide and real-time data.
GBPUSD: Retail trader data shows 38.2% of traders are net-long with the ratio of traders short to long at 1.62 to 1. In fact, traders have remained net-short since Sep 05 when GBPUSD traded near 1.29615; price has moved 3.4% higher since then. The number of traders net-long is 0.1% higher than yesterday and 13.4% higher from last week, while the number of traders net-short is 10.6% lower than yesterday and 18.3% lower from last week.
We typically take a contrarian view to crowd sentiment, and the fact traders are net-short suggests GBPUSD prices may continue to rise. Yet traders are less net-short than yesterday and compared with last week. Recent changes in sentiment warn that the current GBPUSD price trend may soon reverse lower despite the fact traders remain net-short.
— Written by Christopher Vecchio, CFA, Senior Currency Strategist
To contact Christopher Vecchio, e-mail cvecchio@dailyfx.com
Follow him on Twitter at @CVecchioFX
To be added to Christopher’s e-mail distribution list, please fill out this form
- Oil product price pain is set to rise as the Strait of Hormuz stays closed into summer
- Brent crude up USD 9/bl on the week… ”deal around the corner” narrative fades
- Market Still Betting on Timely Resolution, But Each Day Raises Shortage Risk
- TACO (or Whatever It Was) Sends Oil Lower — Iran Keeps Choking Hormuz
- Oil stress is rising as the supply chains and buffers are drained
-
Analys från DailyFX11 år ago
EUR/USD Flirts with Monthly Close Under 30 Year Trendline
-
Marknadsnyheter6 år ago
BrainCool AB (publ): erhåller bidrag (grant) om 0,9 MSEK från Vinnova för bolagets projekt inom behandling av covid-19 patienter med hög feber
-

 Marknadsnyheter3 år ago
Upptäck de bästa verktygen för att analysera Bitcoin!
-
Analys från DailyFX13 år ago
Japanese Yen Breakout or Fakeout? ZAR/JPY May Provide the Answer
-

 Marknadsnyheter3 år ago
Därför föredrar svenska spelare att spela via mobiltelefonen
-
Analys från DailyFX13 år ago
Price & Time: Key Levels to Watch in the Aftermath of NFP
-
Analys från DailyFX9 år ago
Gold Prices Falter at Resistance: Is the Bullish Run Finished?
-
 Nyheter8 år ago
Teknisk analys med Martin Hallström och Nils Brobacke