
Analys från DailyFX
S&P 500: Break Higher Will Bring into Play Yet Another Overhanging T-line
What’s inside:
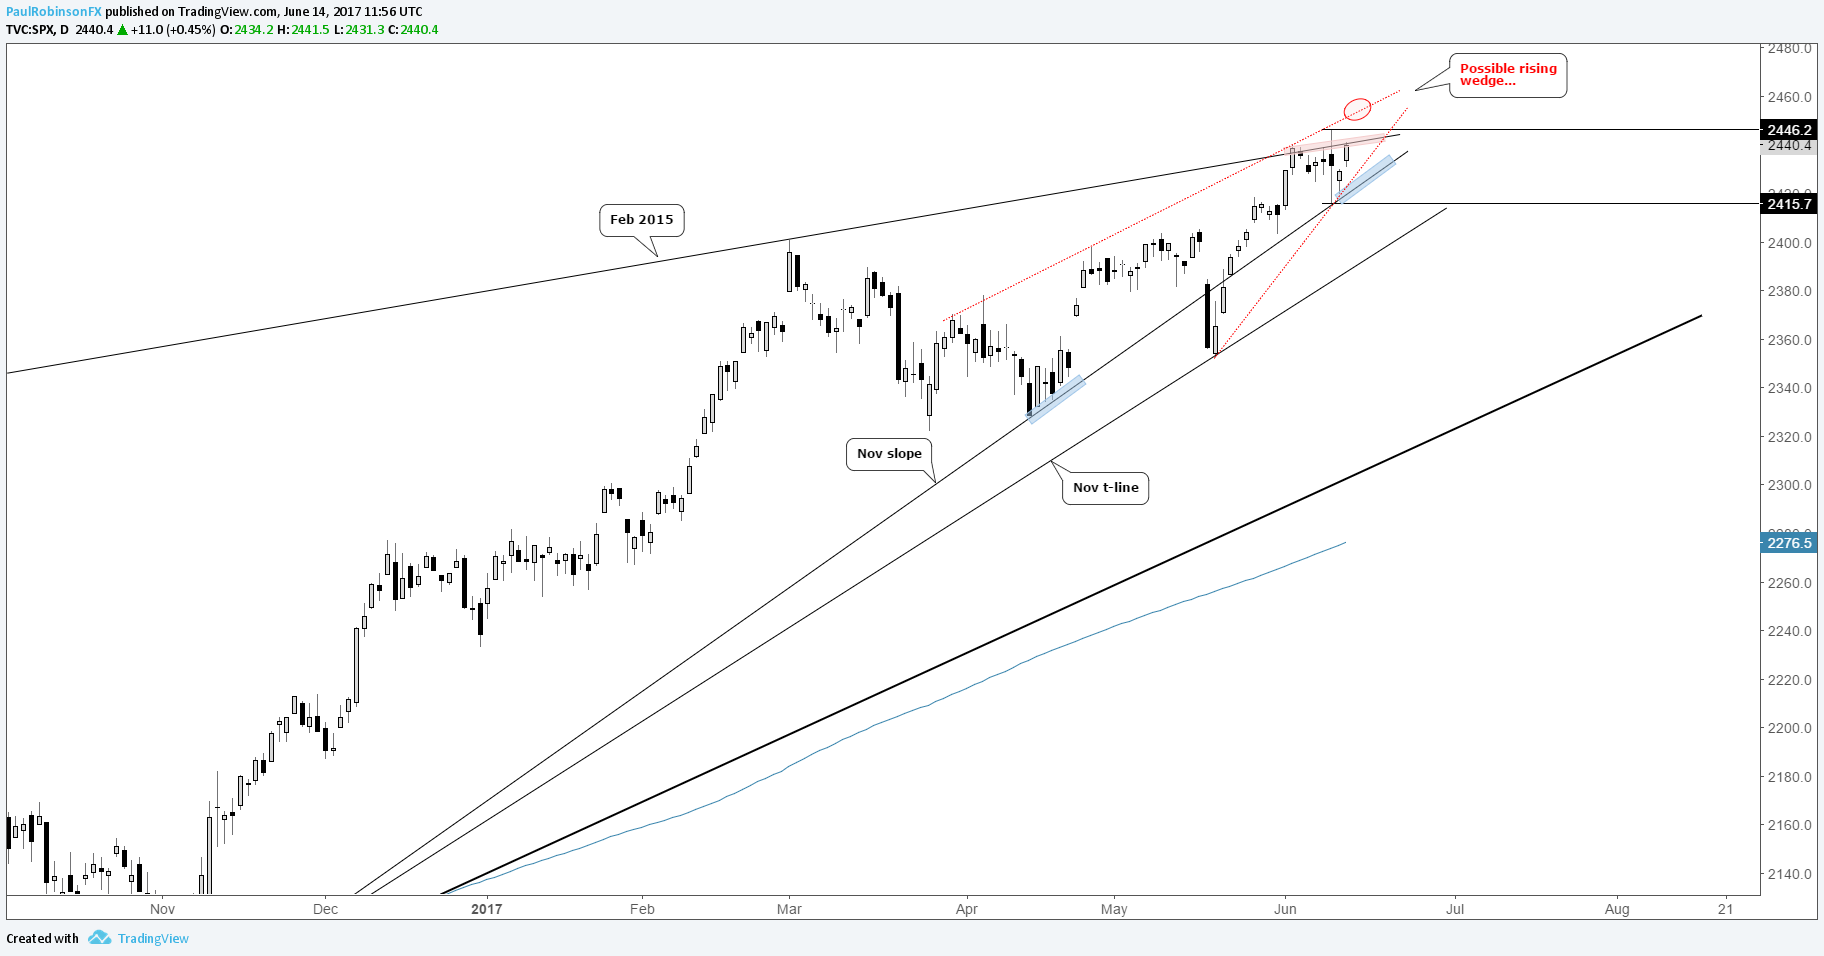
- SP 500 holds November slope, pressing up against Feb 2015 top-side t-line
- A break above the t-line and Friday high of 2446 clears path for move to yet another t-line
- November slope and 2415 keep market constructive until broken; rising wedge scenario may soon come into view.
What’s driving stocks higher? Find out in our market forecasts.
The SP had a wild day on Friday due Goldman Sach’s cautious report regarding the mega-cap stocks which make up a large portion of the Nasdaq 100. While it was a damaging day for the tech-heavy index, the SP managed to close the session relatively unscathed. The low on Friday came at slope support rising up from the November low.
Yesterday’s push higher put the market back at a top-side trend-line running off the February 2015 peak over the March 1 high and recent price action. It’s been a struggle to overcome, but with a push beyond this barrier and above the Friday high at 2446 a path should be cleared for at least another 10 handles or so before possibly stalling again. Another top-side line of resistance (~2355) lies not that far ahead dating back to the end of March, which could also constitute the upper line of a rising wedge. Before we get to that, though, we will need to see it fill out just a bit more and then break either the upper or lower trend-line.
A failure to break and hold above the Friday high, and sharp turn down through the November slope and Friday day low at 2415 would put a dent in a bullish case, and likely see further weakness towards the trend-line extending up from November under the May low.
Later today, the Fed is expected to raise rates by 25 bps, and barring a highly unlikely no-raise or 50 bps, attention will be on signaling by the Fed for the anticipated rate path for the remainder of the year. Barring any strong indications, today’s meeting may be rather uneventful, but as per usual traders should expect the unexpected. Sign up for live coverage of the FOMC announcment with Chief Currency Strategist John Kicklighter here.
SP 500: Daily
Paul conducts webinars every week from Tuesday-Friday. See the Webinar Calendar for details, and the full line-up of all upcoming live events.
—Written by Paul Robinson, Market Analyst
You can receive Paul’s analysis directly via email by signing up here.
You can follow Paul on Twitter at @PaulRobinonFX.


What’s inside:
- EURUSD broke the ‘neckline’ of a bearish ‘head-and-shoulders’ pattern, April trend-line
- Resistance in vicinity of 11825/80 likely to keep a lid on further strength
- Targeting the low to mid-11600s with more selling
Confidence is essential to successful trading, see this new guide – ’Building Confidence in Trading’.
Coming into last week we pointed out the likelihood of finally seeing a resolution of the range EURUSD had been stuck in for the past few weeks, and one of the outcomes we made note of as a possibility was for the triggering of a ’head-and-shoulders’ pattern. Indeed, we saw a break of the ’neckline’ along with a drop below the April trend-line. This led to decent selling before a minor bounce took shape during the latter part of last week.
Looking ahead to next week the euro is set up for further losses as the path of least resistance has turned lower. Looking to a capper on any further strength there is resistance in the 11825-11880 area (old support becomes new resistance). As long as the euro stays below this area a downward bias will remain firmly intact.
Looking lower towards support eyes will be on the August low at 11662 and the 2016 high of 11616, of which the latter just happens to align almost precisely with the measured move target of the ‘head-and-shoulders’ pattern (determined by subtracting the height of the pattern from the neckline).
Bottom line: Shorts look set to have the upperhand as a fresh month gets underway as long as the euro remains capped by resistance. On weakness, we’ll be watching how the euro responds to a drop into support levels.
For a longer-term outlook on EURUSD, check out the just released Q4 Forecast.
EURUSD: Daily

—Written by Paul Robinson, Market Analyst
You can receive Paul’s analysis directly via email bysigning up here.
You can follow Paul on Twitter at@PaulRobinonFX.

Why and how do we use IG Client Sentiment in trading? See our guide and real-time data.
EURUSD: Retail trader data shows 37.3% of traders are net-long with the ratio of traders short to long at 1.68 to 1. In fact, traders have remained net-short since Apr 18 when EURUSD traded near 1.07831; price has moved 9.6% higher since then. The number of traders net-long is 15.4% lower than yesterday and 16.4% higher from last week, while the number of traders net-short is 0.4% higher than yesterday and 10.5% lower from last week.
We typically take a contrarian view to crowd sentiment, and the fact traders are net-short suggests EURUSD prices may continue to rise. Positioning is more net-short than yesterday but less net-short from last week. The combination of current sentiment and recent changes gives us a further mixed EURUSD trading bias.
— Written by Christopher Vecchio, CFA, Senior Currency Strategist
To contact Christopher Vecchio, e-mail cvecchio@dailyfx.com
Follow him on Twitter at @CVecchioFX
To be added to Christopher’s e-mail distribution list, please fill out this form

Why and how do we use IG Client Sentiment in trading? See our guide and real-time data.
GBPUSD: Retail trader data shows 38.2% of traders are net-long with the ratio of traders short to long at 1.62 to 1. In fact, traders have remained net-short since Sep 05 when GBPUSD traded near 1.29615; price has moved 3.4% higher since then. The number of traders net-long is 0.1% higher than yesterday and 13.4% higher from last week, while the number of traders net-short is 10.6% lower than yesterday and 18.3% lower from last week.
We typically take a contrarian view to crowd sentiment, and the fact traders are net-short suggests GBPUSD prices may continue to rise. Yet traders are less net-short than yesterday and compared with last week. Recent changes in sentiment warn that the current GBPUSD price trend may soon reverse lower despite the fact traders remain net-short.
— Written by Christopher Vecchio, CFA, Senior Currency Strategist
To contact Christopher Vecchio, e-mail cvecchio@dailyfx.com
Follow him on Twitter at @CVecchioFX
To be added to Christopher’s e-mail distribution list, please fill out this form
-
Analys från DailyFX10 år ago
EUR/USD Flirts with Monthly Close Under 30 Year Trendline
-
Marknadsnyheter5 år ago
BrainCool AB (publ): erhåller bidrag (grant) om 0,9 MSEK från Vinnova för bolagets projekt inom behandling av covid-19 patienter med hög feber
-

 Marknadsnyheter2 år ago
Upptäck de bästa verktygen för att analysera Bitcoin!
-
Analys från DailyFX12 år ago
Japanese Yen Breakout or Fakeout? ZAR/JPY May Provide the Answer
-

 Marknadsnyheter2 år ago
Därför föredrar svenska spelare att spela via mobiltelefonen
-
Analys från DailyFX12 år ago
Price & Time: Key Levels to Watch in the Aftermath of NFP
-
Analys från DailyFX8 år ago
Gold Prices Falter at Resistance: Is the Bullish Run Finished?
-
 Nyheter7 år ago
Teknisk analys med Martin Hallström och Nils Brobacke