
Analys från DailyFX
US Dollar Doldrums Takes DXY to Levels from Brexit Day
What will save the USD from its 2017 downtrend? Get a free DFX Q3 market forecast here
Key Takeaways:
- DXY Technical Strategy: DXY remains in “sell the rips” mode below 95.17
- DXY polarity point of 96.50 remains technical line in the sand, bearish below
- Dollar weakness picks up pace as EUR breaks to highest weekly close since January ‘15
It was the best of times (for EUR bulls), it was the worst of times (for USD bulls). As the month of July comes to a close, the best thing the USD seems to have going for it in terms of being worth buying is that the market is only pricing in roughly one hike from the Fed in 2018. The market to look at this expectation is the Eurodollar futures spread between December 2018 and December 2017, which is currently below 30bps or a little more than one rate hike in 2018.
Recommended Reading: 3 Big Mistakes Traders Are Making in 2017 And How To Correct Them
The small expectation for Fed hawkishness in 2018 means that the best proponent of USD breakout is from a contrarian perspective, but many including institutional speculators are giving up on the greenback. Case in point, when looking at the market’s form of breakout or breakdown insurance, Risk Reversals in the options market, we see the highest cost to protect against a drop in the USD against the EUR (read: EUR/USD higher is expected) since 2009. The measure used to come up with that figure is the 10-delta risk reversal, which shows a relative extreme not seen since 2009 to have the option to buy (call) vs. the option to sell (put) should an extreme EUR bullish move develop. When looking at EUR/USD, the market is likely focusing on 1.1714, the 2015 high after China shocked the world from devaluing the Yuan in order to support their economy, which appears to have worked well when looking at recent economic data such as GDP.
Either way you cut it, the USD remains on a back foot, and further losses in the DXY should not come as a surprise. The short-term technical level to watch would be 95.17, the high from July 20 when the ECB gave a dovish message that the market ignored to buy more EUR. The broader picture of DXY would discount any bullish view below 96.50, which acts as a polarity point on the chart. A close above this level, some 300 points away, would be the best indication that the hedge funds who are shorting the USD have lost their edge. Until then, to the victor BELONGS the spoils.
If you would be interested in seeing how retail traders’ are bettingin key markets, see IG Client Sentiment here!
Join Tyler in his Daily Closing Bell webinars at 3 pm ET to discuss this market.
DXY below 96.50 keeps thefocus on downside extension targets @ 93.1, EUR/USD 1.16

Chart Created by Tyler Yell, CMT
IG Client Sentiment Highlight: EUR (57.6% of DXY) Sentiment favors further DXY downside
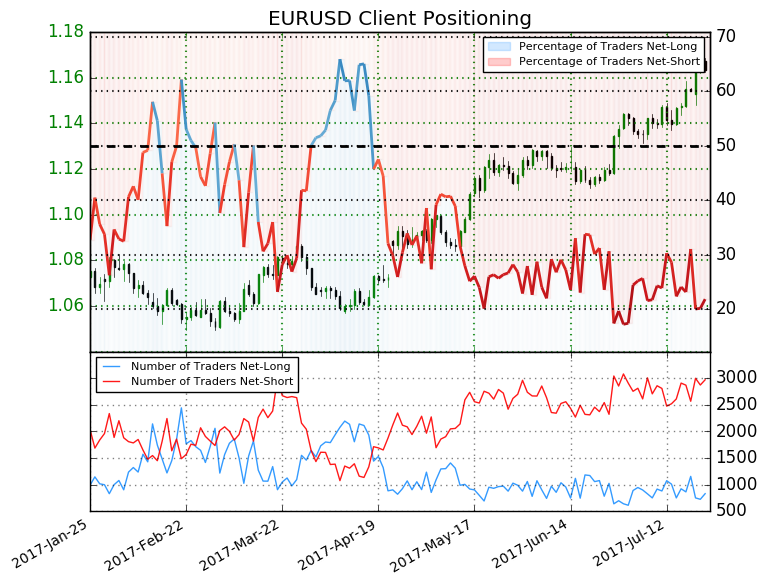
EURUSD: Retail trader data shows 21.9% of traders are net-long with the ratio of traders short to long at 3.57 to 1. In fact, traders have remained net-short since Apr 18 when EURUSD traded near 1.06665; theprice has moved 9.1% higher since then. The number of traders net-long is 4.1% lower than yesterday and 20.5% lower from last week, while the number of traders net-short is 2.7% higher than yesterday and 9.8% higher from last week.
We typically take a contrarian view to crowd sentiment, and the fact traders are net-short suggests EURUSD prices may continue to rise. Traders are further net-short than yesterday and last week, and the combination of current sentiment and recent changes gives us a stronger EURUSD-bullish contrarian trading bias. (Emphasis mine)
—
Written by Tyler Yell, CMT, Currency Analyst Trading Instructor for DailyFX.com
To receive Tyler’s analysis directly via email, please SIGN UP HERE
Contact and discuss markets with Tyler on Twitter: @ForexYell


What’s inside:
- EURUSD broke the ‘neckline’ of a bearish ‘head-and-shoulders’ pattern, April trend-line
- Resistance in vicinity of 11825/80 likely to keep a lid on further strength
- Targeting the low to mid-11600s with more selling
Confidence is essential to successful trading, see this new guide – ’Building Confidence in Trading’.
Coming into last week we pointed out the likelihood of finally seeing a resolution of the range EURUSD had been stuck in for the past few weeks, and one of the outcomes we made note of as a possibility was for the triggering of a ’head-and-shoulders’ pattern. Indeed, we saw a break of the ’neckline’ along with a drop below the April trend-line. This led to decent selling before a minor bounce took shape during the latter part of last week.
Looking ahead to next week the euro is set up for further losses as the path of least resistance has turned lower. Looking to a capper on any further strength there is resistance in the 11825-11880 area (old support becomes new resistance). As long as the euro stays below this area a downward bias will remain firmly intact.
Looking lower towards support eyes will be on the August low at 11662 and the 2016 high of 11616, of which the latter just happens to align almost precisely with the measured move target of the ‘head-and-shoulders’ pattern (determined by subtracting the height of the pattern from the neckline).
Bottom line: Shorts look set to have the upperhand as a fresh month gets underway as long as the euro remains capped by resistance. On weakness, we’ll be watching how the euro responds to a drop into support levels.
For a longer-term outlook on EURUSD, check out the just released Q4 Forecast.
EURUSD: Daily

—Written by Paul Robinson, Market Analyst
You can receive Paul’s analysis directly via email bysigning up here.
You can follow Paul on Twitter at@PaulRobinonFX.

Why and how do we use IG Client Sentiment in trading? See our guide and real-time data.
EURUSD: Retail trader data shows 37.3% of traders are net-long with the ratio of traders short to long at 1.68 to 1. In fact, traders have remained net-short since Apr 18 when EURUSD traded near 1.07831; price has moved 9.6% higher since then. The number of traders net-long is 15.4% lower than yesterday and 16.4% higher from last week, while the number of traders net-short is 0.4% higher than yesterday and 10.5% lower from last week.
We typically take a contrarian view to crowd sentiment, and the fact traders are net-short suggests EURUSD prices may continue to rise. Positioning is more net-short than yesterday but less net-short from last week. The combination of current sentiment and recent changes gives us a further mixed EURUSD trading bias.
— Written by Christopher Vecchio, CFA, Senior Currency Strategist
To contact Christopher Vecchio, e-mail cvecchio@dailyfx.com
Follow him on Twitter at @CVecchioFX
To be added to Christopher’s e-mail distribution list, please fill out this form

Why and how do we use IG Client Sentiment in trading? See our guide and real-time data.
GBPUSD: Retail trader data shows 38.2% of traders are net-long with the ratio of traders short to long at 1.62 to 1. In fact, traders have remained net-short since Sep 05 when GBPUSD traded near 1.29615; price has moved 3.4% higher since then. The number of traders net-long is 0.1% higher than yesterday and 13.4% higher from last week, while the number of traders net-short is 10.6% lower than yesterday and 18.3% lower from last week.
We typically take a contrarian view to crowd sentiment, and the fact traders are net-short suggests GBPUSD prices may continue to rise. Yet traders are less net-short than yesterday and compared with last week. Recent changes in sentiment warn that the current GBPUSD price trend may soon reverse lower despite the fact traders remain net-short.
— Written by Christopher Vecchio, CFA, Senior Currency Strategist
To contact Christopher Vecchio, e-mail cvecchio@dailyfx.com
Follow him on Twitter at @CVecchioFX
To be added to Christopher’s e-mail distribution list, please fill out this form
- Tightening fundamentals – bullish inventories from DOE
- Bombs to ”ceasefire” in hours – Brent below $70
- A muted price reaction. Market looks relaxed, but it is still on edge waiting for what Iran will do
- Very relaxed at USD 75/b. Risk barometer will likely fluctuate to higher levels with Brent into the 80ies or higher coming 2-3 weeks
- Brent needs to fall to USD 58/b to make cheating unprofitable for Kazakhstan
-
Analys från DailyFX10 år ago
EUR/USD Flirts with Monthly Close Under 30 Year Trendline
-
Marknadsnyheter5 år ago
BrainCool AB (publ): erhåller bidrag (grant) om 0,9 MSEK från Vinnova för bolagets projekt inom behandling av covid-19 patienter med hög feber
-

 Marknadsnyheter2 år ago
Upptäck de bästa verktygen för att analysera Bitcoin!
-
Analys från DailyFX12 år ago
Japanese Yen Breakout or Fakeout? ZAR/JPY May Provide the Answer
-

 Marknadsnyheter2 år ago
Därför föredrar svenska spelare att spela via mobiltelefonen
-
Analys från DailyFX12 år ago
Price & Time: Key Levels to Watch in the Aftermath of NFP
-
Analys från DailyFX8 år ago
Gold Prices Falter at Resistance: Is the Bullish Run Finished?
-
 Nyheter7 år ago
Teknisk analys med Martin Hallström och Nils Brobacke