
Analys från DailyFX
USD/CAD Technical Analysis: CAD Strength Needs Oil to Follow Through
Where have the commodity FX buyers gone in 2Q? See our forecast to find out what’s driving market trends!
Talking Points:
- USD/CAD technical strategy: strong zone of support (1.3575/3441) likely to hold
- USD/CAD downside momentum currently stalled, watching support at 1.3575
- 1-week CAD volatility rising in anticipation of BoC decision/ NAFTA renegotiations
The Canadian Dollar continues to consolidate losses against the USD following the rebound in Crude Oil. In recent days, markets were cheered to hear that Saudi Arabia Russia were encouraged by the lack of progress in their first round of production cuts to extend the next round of production cuts into Q1 2018. Naturally, US EP in shale regions continues to pump aggressively, though production has dropped for the first time in 13 weeks, this news helped lift the price of Oil as well as Canadian Dollar demand.
Many traders wondering whether or not CAD will remain under pressure and USD/CAD would possible move higher are encouraged to look at the charts, which shows a large zone of price support from prior resistance starting at 1.3575. A failure for the price to penetrate the 1.3575/3441 support zone followed by a move above 1.3700 would favor a continuation higher even though some favored oscillators show USD/CAD as overbought.
Next week, traders can look to the Bank of Canada, which is fully expected to keep rates on hold despite an overheating housing market that recently caused Moody’s to downgrade a handful of Canadian financials. Should USD weakness persist, we could see further downside in USD/CAD, which would likely test the 61.8% Fibonacci level of the April/May rise at 1.3441. A close below 1.3441 would favor a stronger reversal in the pair and market developments should be watched to find the appropriate driver and whether or not it is expected to continue.
Join Tyler at his Daily Closing Bell webinars at 3 pm ET to discuss key market developments.
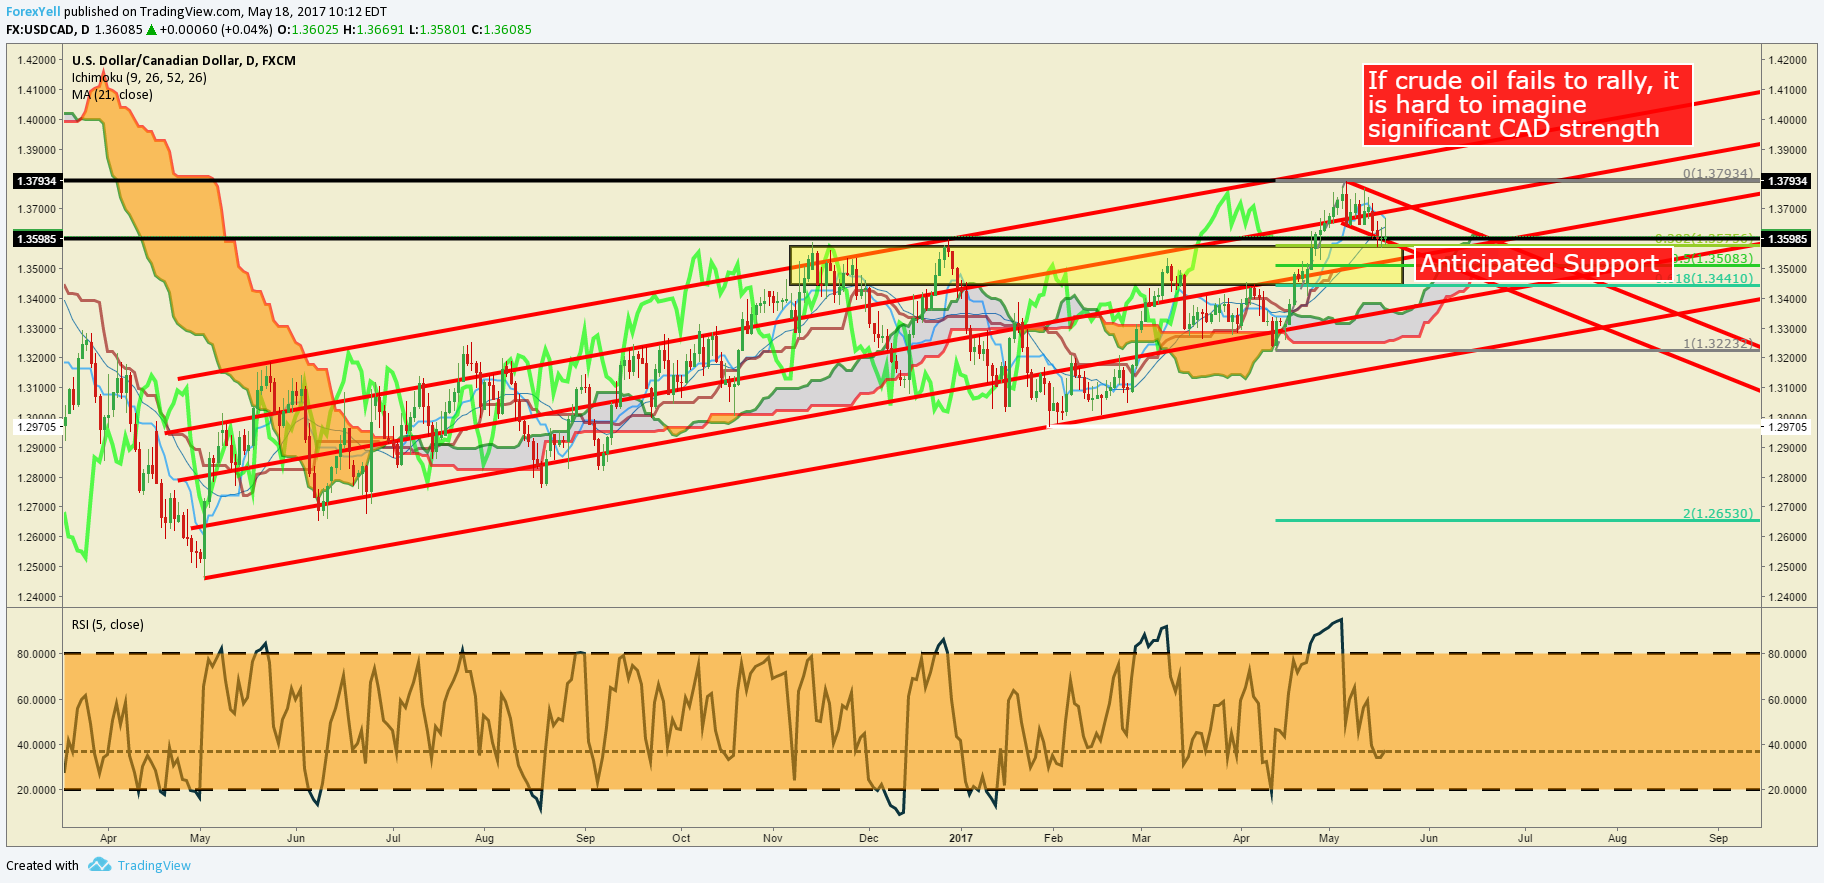
Chart Created by Tyler Yell, CMT
USD/CAD Insight from IG Client Positioning
The sentiment highlight section is designed to help you see how DailyFX utilizes the insights derived from IG Client Sentiment, and how client positioning can lead to trade ideas. If you have any questions on this indicator, you are welcome to reach out to the author of this article with questions at tyell@dailyfx.com.
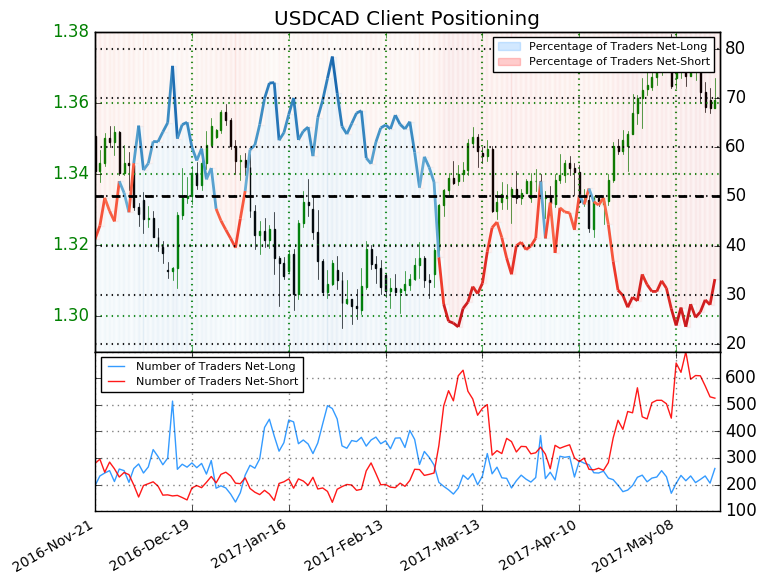
USDCAD: Retail trader data shows 33.2% of traders are net-long with the ratio of traders short to long at 2.01 to 1. In fact, traders have remained net-short since Apr 18 when USDCAD traded near 1.33163; the price has moved 2.2% higher since then. The number of traders net-long is unchanged than yesterday and 18.1% higher from last week, while the number of traders net-short is 8.5% lower than yesterday and 19.6% lower from last week.
We typically take a contrarian view to crowd sentiment, and the fact traders are net-short suggests USDCAD prices may continue to rise. Yet traders are less net-short than yesterday and compared with last week. Recent changes in sentiment warn that the current USDCAD price trend may soon reverse lower despite the fact traders remain net-short. (Emphasis mine)
—
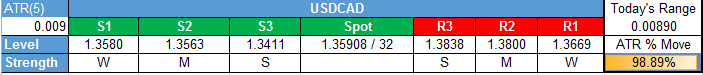
Shorter-Term USD/CAD Technical Levels: Thursday, May 18, 2017
For those interested in shorter-term levels of focus than the ones above, these levels signal important potential pivot levels over the next 48-hours.
Contact and discuss markets with Tyler on Twitter: @ForexYell


What’s inside:
- EURUSD broke the ‘neckline’ of a bearish ‘head-and-shoulders’ pattern, April trend-line
- Resistance in vicinity of 11825/80 likely to keep a lid on further strength
- Targeting the low to mid-11600s with more selling
Confidence is essential to successful trading, see this new guide – ’Building Confidence in Trading’.
Coming into last week we pointed out the likelihood of finally seeing a resolution of the range EURUSD had been stuck in for the past few weeks, and one of the outcomes we made note of as a possibility was for the triggering of a ’head-and-shoulders’ pattern. Indeed, we saw a break of the ’neckline’ along with a drop below the April trend-line. This led to decent selling before a minor bounce took shape during the latter part of last week.
Looking ahead to next week the euro is set up for further losses as the path of least resistance has turned lower. Looking to a capper on any further strength there is resistance in the 11825-11880 area (old support becomes new resistance). As long as the euro stays below this area a downward bias will remain firmly intact.
Looking lower towards support eyes will be on the August low at 11662 and the 2016 high of 11616, of which the latter just happens to align almost precisely with the measured move target of the ‘head-and-shoulders’ pattern (determined by subtracting the height of the pattern from the neckline).
Bottom line: Shorts look set to have the upperhand as a fresh month gets underway as long as the euro remains capped by resistance. On weakness, we’ll be watching how the euro responds to a drop into support levels.
For a longer-term outlook on EURUSD, check out the just released Q4 Forecast.
EURUSD: Daily

—Written by Paul Robinson, Market Analyst
You can receive Paul’s analysis directly via email bysigning up here.
You can follow Paul on Twitter at@PaulRobinonFX.

Why and how do we use IG Client Sentiment in trading? See our guide and real-time data.
EURUSD: Retail trader data shows 37.3% of traders are net-long with the ratio of traders short to long at 1.68 to 1. In fact, traders have remained net-short since Apr 18 when EURUSD traded near 1.07831; price has moved 9.6% higher since then. The number of traders net-long is 15.4% lower than yesterday and 16.4% higher from last week, while the number of traders net-short is 0.4% higher than yesterday and 10.5% lower from last week.
We typically take a contrarian view to crowd sentiment, and the fact traders are net-short suggests EURUSD prices may continue to rise. Positioning is more net-short than yesterday but less net-short from last week. The combination of current sentiment and recent changes gives us a further mixed EURUSD trading bias.
— Written by Christopher Vecchio, CFA, Senior Currency Strategist
To contact Christopher Vecchio, e-mail cvecchio@dailyfx.com
Follow him on Twitter at @CVecchioFX
To be added to Christopher’s e-mail distribution list, please fill out this form

Why and how do we use IG Client Sentiment in trading? See our guide and real-time data.
GBPUSD: Retail trader data shows 38.2% of traders are net-long with the ratio of traders short to long at 1.62 to 1. In fact, traders have remained net-short since Sep 05 when GBPUSD traded near 1.29615; price has moved 3.4% higher since then. The number of traders net-long is 0.1% higher than yesterday and 13.4% higher from last week, while the number of traders net-short is 10.6% lower than yesterday and 18.3% lower from last week.
We typically take a contrarian view to crowd sentiment, and the fact traders are net-short suggests GBPUSD prices may continue to rise. Yet traders are less net-short than yesterday and compared with last week. Recent changes in sentiment warn that the current GBPUSD price trend may soon reverse lower despite the fact traders remain net-short.
— Written by Christopher Vecchio, CFA, Senior Currency Strategist
To contact Christopher Vecchio, e-mail cvecchio@dailyfx.com
Follow him on Twitter at @CVecchioFX
To be added to Christopher’s e-mail distribution list, please fill out this form
- Brent needs to fall to USD 58/b to make cheating unprofitable for Kazakhstan
- All eyes on OPEC V8 and their July quota decision on Saturday
- Brent steady at $65 ahead of OPEC+ and Iran outcomes
- A shift to surplus will likely drive Brent towards the 60-line and the high 50ies
- An Israeli attack on Iran moves closer as Trump’s bully-diplomacy has reach a dead end
-
Analys från DailyFX10 år ago
EUR/USD Flirts with Monthly Close Under 30 Year Trendline
-

 Marknadsnyheter2 år ago
Upptäck de bästa verktygen för att analysera Bitcoin!
-
Marknadsnyheter5 år ago
BrainCool AB (publ): erhåller bidrag (grant) om 0,9 MSEK från Vinnova för bolagets projekt inom behandling av covid-19 patienter med hög feber
-
Analys från DailyFX12 år ago
Japanese Yen Breakout or Fakeout? ZAR/JPY May Provide the Answer
-

 Marknadsnyheter2 år ago
Därför föredrar svenska spelare att spela via mobiltelefonen
-
Analys från DailyFX12 år ago
Price & Time: Key Levels to Watch in the Aftermath of NFP
-
Analys från DailyFX8 år ago
Gold Prices Falter at Resistance: Is the Bullish Run Finished?
-
 Nyheter7 år ago
Teknisk analys med Martin Hallström och Nils Brobacke