
Analys från DailyFX
USD/JPY Price Analysis: Yen remains deceptively strong, USD still weak
Unsure what’s on the horizon for your favorite currency? Access our free forecasts by clicking here.
Highlights:
- USD/JPY technical strategy: low volatility into long-term support, anticipating bounce
- 2017 extreme day (April 17) range (109.05-108.13) acting as strong support pair
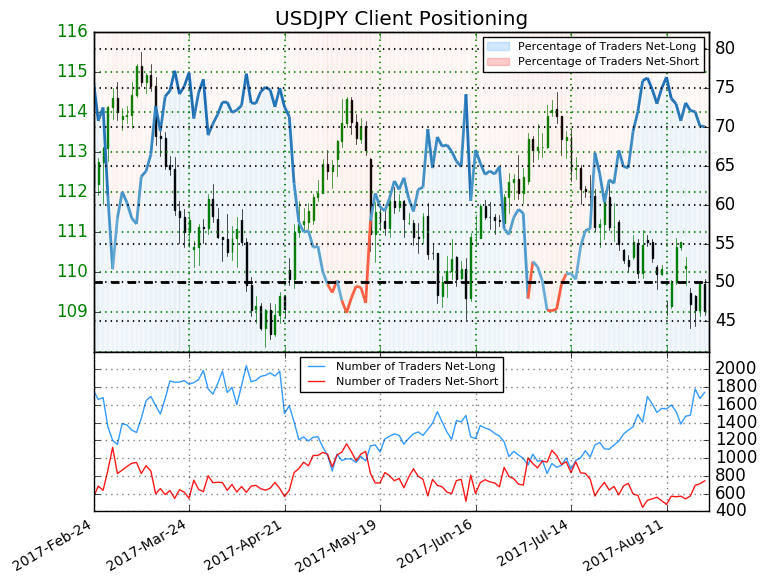
- IGCS Sentiment Highlight:US Dollar Likely to Fall even Further versus Japanese Yen
A dear old colleague of mine used to share with me the advice, friends, do not let friends sell at support. Today is a day to practice that discipline. The JPY has been deceptively strong. An index I run to help me see relative strength and weakness across G10FX shows that JPY remains the strongest currency in the G10 outpacing the EUR, which just closed at the highest level to the GBP since 2009. However, traders when looking at other markets are likely scratching their heads to the JPY strength.
Stocks are off their highs, but not by much. Commodities, lifted by base metals have seen astounding gains with Iron Ore higher by 50% in 50-days since the June low. Lastly, Emerging Markets continue to attract capital via ETFs and bonds that keeps support under higher-yielding EMFX. This all paints a picture that tends to align with a weak JPY. However, the disconnect is that the JPY remains deceptively strong.
USD/JPY is within 1X ATR(5) (82 pips) of a new 2017 low. Much of that has to do, of course, with the weak USD, but what appears too important to ignore is that traders are not comfortable selling JPY, at least not across the board that tends to go with times of blatant risk-seeking behavior.
The technical picture of the USD/JPY cross is rather simple. If we see a price break and close below 108.13, all hands will be on deck to see if imminent JPY strength is back and if it can take USD/JPY lower to 107.50 followed by 105.30, the two key support zones in view. If USD/JPY breaks above the recent resistance of 110.37 (Aug. 17 high), we may be seeing a reversal to the top of the long-term range in the 114 zone.
Friends may not let friends sell at support because a bounce could easily happen when you look at the plethora of support that combines the extreme day price range from April 17 as well as the rising Trendline from last August (red line on the chart below). However, friends should keep one another company in watching to see if the price break signals a larger shift in the FX market. Such a break would show the strongest currency in G10FX at time of this writing (JPY) is likely about to get its second wind (or fifth) in 2017 or if we’re witnessing a broader breakdown of USD.Either way, a close below 108.13 in USD/JPY should be on your radar. Should such a break happen before the trading activity picks up in September as per seasonality patterns, it could mean the path of resistance on this pair stays lower, and the charts could point lower for longer.
Join Tyler in his Daily Closing Bell webinars at 3 pm ET to discuss market developments.
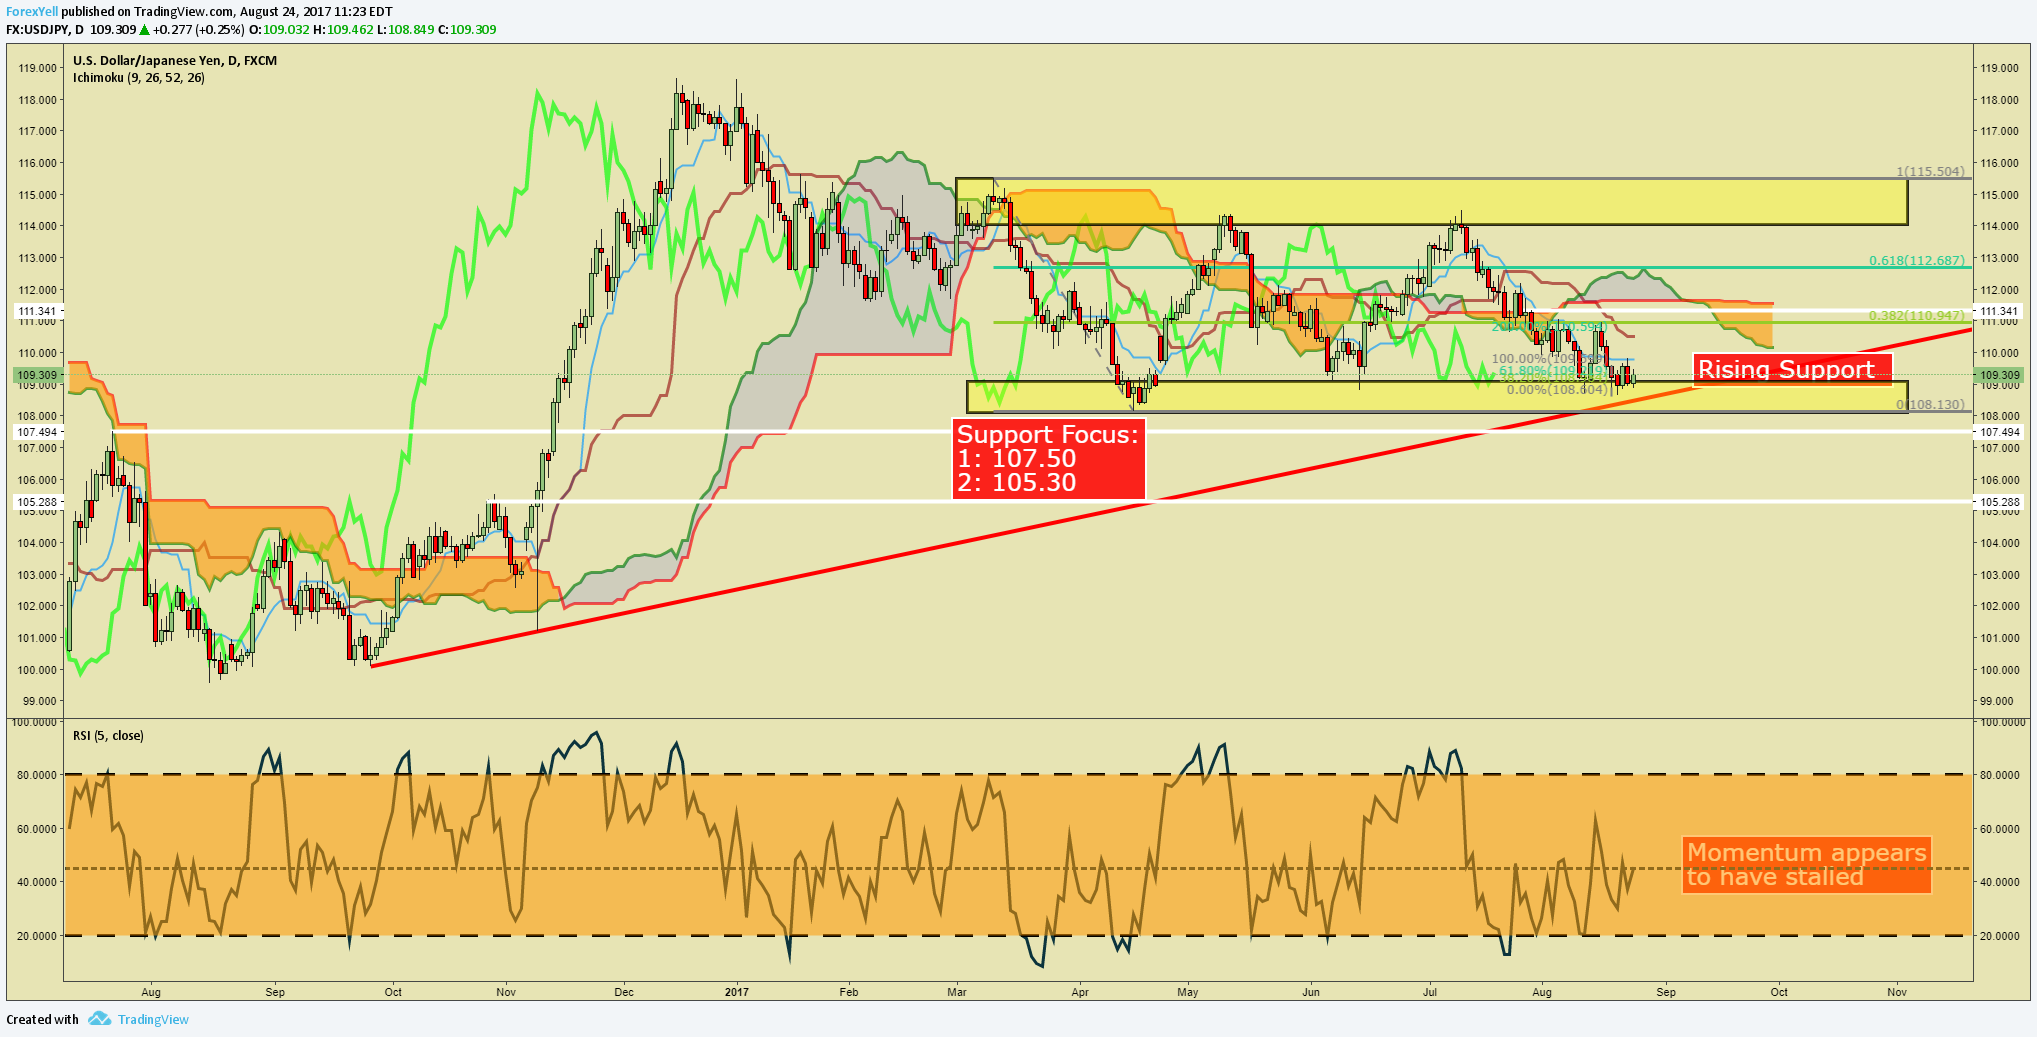
Chart Created by Tyler Yell, CMT
IGCS Sentiment Highlight:US Dollar Likely to Fall even Further versus Japanese Yen
What do retail traders’ buy/sell decisions hint about the JPY trend? Find out here!
USDJPY: Retail trader data shows 70.1% of traders are net-long with the ratio of traders long to short at 2.34 to 1. In fact, traders have remained net-long since Jul 18 when USDJPY traded near 113.359; theprice has moved 3.8% lower since then. The number of traders net-long is 4.9% higher than yesterday and 19.7% higher from last week, while the number of traders net-short is 3.5% higher than yesterday and 11.7% higher from last week.
We typically take a contrarian view to crowd sentiment, and the fact traders are net-long suggests USDJPY prices may continue to fall. Traders are further net-long than yesterday and last week, and the combination of current sentiment and recent changes gives us a stronger USDJPY-bearish contrarian trading bias (emphasis added).
–—
Written by Tyler Yell, CMT, Currency Analyst Trading Instructor for DailyFX.com
To receive Tyler’s analysis directly via email, please SIGN UP HERE
Contact and discuss markets with Tyler on Twitter: @ForexYell


What’s inside:
- EURUSD broke the ‘neckline’ of a bearish ‘head-and-shoulders’ pattern, April trend-line
- Resistance in vicinity of 11825/80 likely to keep a lid on further strength
- Targeting the low to mid-11600s with more selling
Confidence is essential to successful trading, see this new guide – ’Building Confidence in Trading’.
Coming into last week we pointed out the likelihood of finally seeing a resolution of the range EURUSD had been stuck in for the past few weeks, and one of the outcomes we made note of as a possibility was for the triggering of a ’head-and-shoulders’ pattern. Indeed, we saw a break of the ’neckline’ along with a drop below the April trend-line. This led to decent selling before a minor bounce took shape during the latter part of last week.
Looking ahead to next week the euro is set up for further losses as the path of least resistance has turned lower. Looking to a capper on any further strength there is resistance in the 11825-11880 area (old support becomes new resistance). As long as the euro stays below this area a downward bias will remain firmly intact.
Looking lower towards support eyes will be on the August low at 11662 and the 2016 high of 11616, of which the latter just happens to align almost precisely with the measured move target of the ‘head-and-shoulders’ pattern (determined by subtracting the height of the pattern from the neckline).
Bottom line: Shorts look set to have the upperhand as a fresh month gets underway as long as the euro remains capped by resistance. On weakness, we’ll be watching how the euro responds to a drop into support levels.
For a longer-term outlook on EURUSD, check out the just released Q4 Forecast.
EURUSD: Daily

—Written by Paul Robinson, Market Analyst
You can receive Paul’s analysis directly via email bysigning up here.
You can follow Paul on Twitter at@PaulRobinonFX.

Why and how do we use IG Client Sentiment in trading? See our guide and real-time data.
EURUSD: Retail trader data shows 37.3% of traders are net-long with the ratio of traders short to long at 1.68 to 1. In fact, traders have remained net-short since Apr 18 when EURUSD traded near 1.07831; price has moved 9.6% higher since then. The number of traders net-long is 15.4% lower than yesterday and 16.4% higher from last week, while the number of traders net-short is 0.4% higher than yesterday and 10.5% lower from last week.
We typically take a contrarian view to crowd sentiment, and the fact traders are net-short suggests EURUSD prices may continue to rise. Positioning is more net-short than yesterday but less net-short from last week. The combination of current sentiment and recent changes gives us a further mixed EURUSD trading bias.
— Written by Christopher Vecchio, CFA, Senior Currency Strategist
To contact Christopher Vecchio, e-mail cvecchio@dailyfx.com
Follow him on Twitter at @CVecchioFX
To be added to Christopher’s e-mail distribution list, please fill out this form

Why and how do we use IG Client Sentiment in trading? See our guide and real-time data.
GBPUSD: Retail trader data shows 38.2% of traders are net-long with the ratio of traders short to long at 1.62 to 1. In fact, traders have remained net-short since Sep 05 when GBPUSD traded near 1.29615; price has moved 3.4% higher since then. The number of traders net-long is 0.1% higher than yesterday and 13.4% higher from last week, while the number of traders net-short is 10.6% lower than yesterday and 18.3% lower from last week.
We typically take a contrarian view to crowd sentiment, and the fact traders are net-short suggests GBPUSD prices may continue to rise. Yet traders are less net-short than yesterday and compared with last week. Recent changes in sentiment warn that the current GBPUSD price trend may soon reverse lower despite the fact traders remain net-short.
— Written by Christopher Vecchio, CFA, Senior Currency Strategist
To contact Christopher Vecchio, e-mail cvecchio@dailyfx.com
Follow him on Twitter at @CVecchioFX
To be added to Christopher’s e-mail distribution list, please fill out this form
- Are Ukraine’s attacks on Russian energy infrastructure working?
- Market waiting and watching for when seasonally softer demand meets rising OPEC+ supply
- Brent crude ticks higher on tension, but market structure stays soft
- Volatile but going nowhere. Brent crude circles USD 66 as market weighs surplus vs risk
- Waiting for the surplus while we worry about Israel and Qatar
-
Analys från DailyFX10 år ago
EUR/USD Flirts with Monthly Close Under 30 Year Trendline
-
Marknadsnyheter5 år ago
BrainCool AB (publ): erhåller bidrag (grant) om 0,9 MSEK från Vinnova för bolagets projekt inom behandling av covid-19 patienter med hög feber
-

 Marknadsnyheter3 år ago
Upptäck de bästa verktygen för att analysera Bitcoin!
-
Analys från DailyFX12 år ago
Japanese Yen Breakout or Fakeout? ZAR/JPY May Provide the Answer
-

 Marknadsnyheter2 år ago
Därför föredrar svenska spelare att spela via mobiltelefonen
-
Analys från DailyFX12 år ago
Price & Time: Key Levels to Watch in the Aftermath of NFP
-
Analys från DailyFX8 år ago
Gold Prices Falter at Resistance: Is the Bullish Run Finished?
-
 Nyheter7 år ago
Teknisk analys med Martin Hallström och Nils Brobacke