
Analys från DailyFX
USD/JPY Pushing Into Critical Resistance Alongside Correlated Markets
Key Takeaways:
- USD/JPY technical strategy: breakout above 200-DMA/ trendline could signal breakout
- 200-DMA (112.195) and 2017 falling trendline acting as key resistance on move
- IGCS Highlight: Drop in net-long exposure favors contrarian via of upside
A textbook definition of a downtrend is a series of lower lows and lower highs on the chart and time frame you’re following. The question is, when does a lower high break higher and thus signal a changing of a trend from lower to higher? USD/JPY is at a potential breaking point such that if the downtrend remains, here is a great place for the market to turn. Highly correlated markets like the US Treasury 10Yr Yields (overlaid as a line on the chart below) are also at a seeming turning point.
The key point on the chart of USD/JPY is that the price pattern is that of a wedge. Wedges tend to indicate big moves on the horizon. However, the direction of the move is less certain. A similar wedge pattern is developing in UST 10Yr Yields. The direction of the wedge is lower since the double top in yields from late 2016, early 2017 at the 2.62 level.
The USD/JPY chart did not post a similar double-top, and in fact, was a helpful tell that there was an underlying weakness in the second move higher in US Yields as JPY strength kept a lid on USD/JPY appreciation. We’re at a similar point where both markets are pushing to resistance, and the next move higher or lower could dictate the market, as well as overall risk-sentiment going forward.
From a fundamental perspective, the markets await FOMC, which is unlikely to surprise in a hawkish given uneven data prints in the US. A more dovish than anticipated Fed would motivate the broader USD selling trend and likely send USD/JPY lower. In Japan, the focal events are the BoJ and the Lower House election, which is not expected to directly affect the JPY due to the recent subdued JPY price volatility.
The most Bullish development would be a daily close above the Ichimoku Cloud (ceiling is at yesterday’s close), and the 200-DMA (aligning with the 2017 trendline). The zone of this resistance is 111.60-112.20. This 60 pip zone could act as strong resistance. A break above this zone would favor a move to the 2017 resistance point of 114/5. A failure to breakout from here could usher in a wave of treasury buying (lower yields), and JPY strength. This bearish development would be best confirmed on the move back below 110 on a daily close basis.
Daily USD/JPY Chart: Strong resistance into 111.60/112.20 Zone (Ichimoku + 200-DMA)
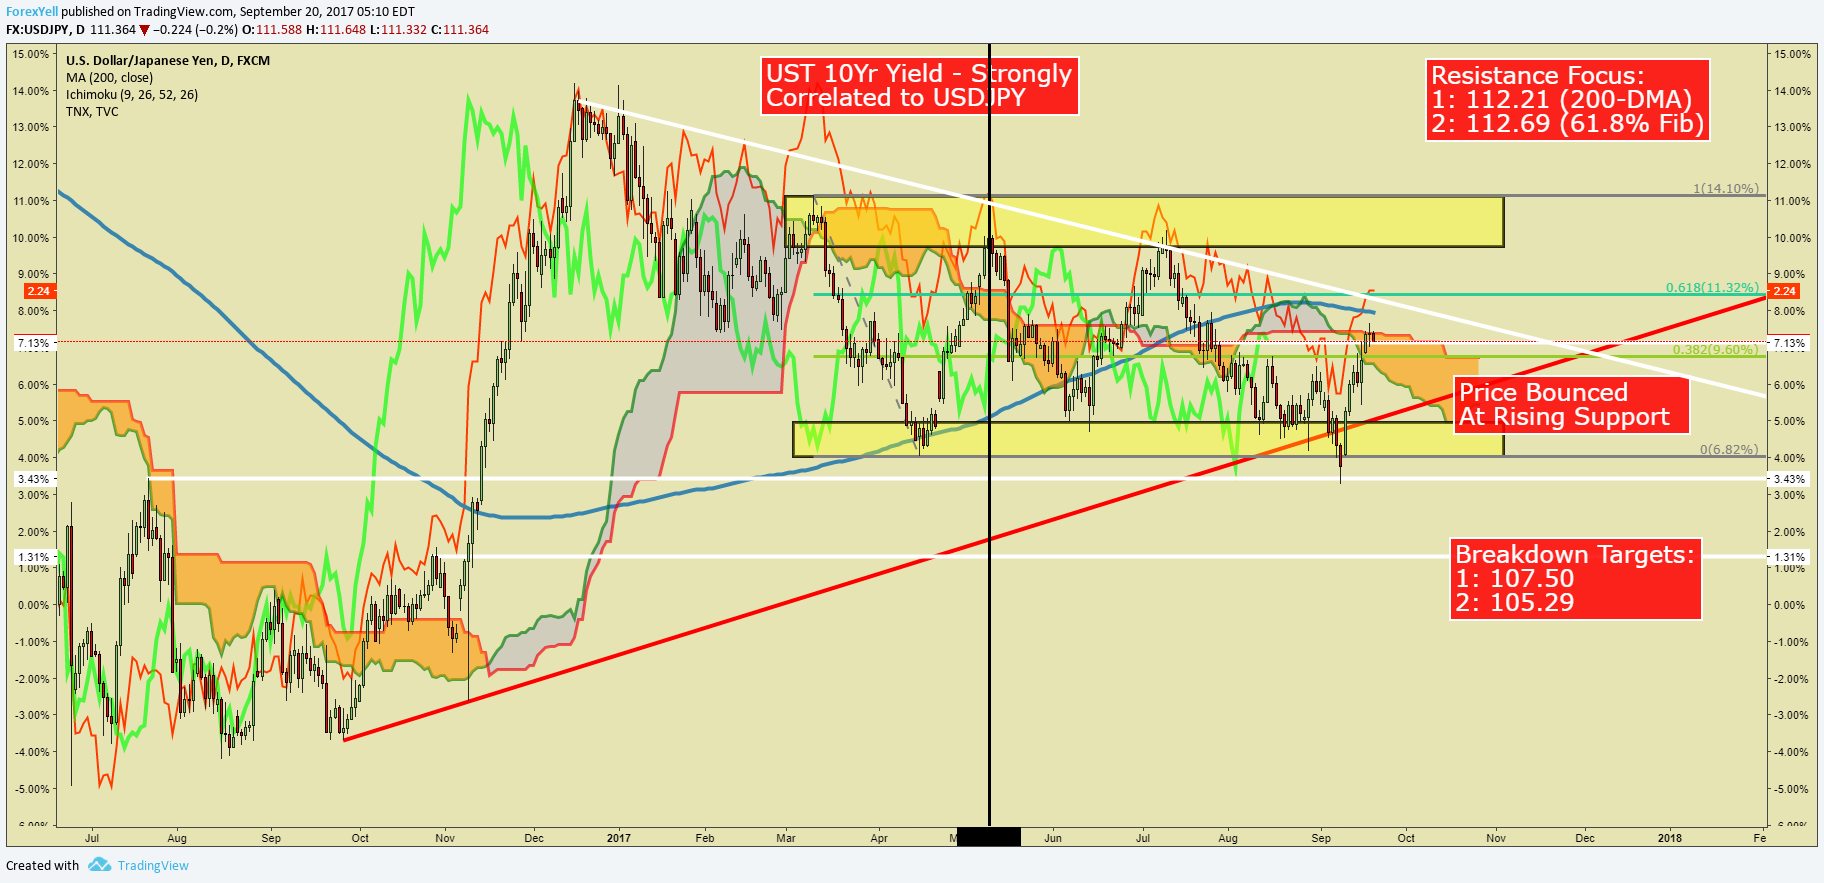
Chart Created by Tyler Yell, CMT
USD/JPY Insight from IG Client Positioning: Drop in net-long exposure favors reversal higher
The sentiment highlight section is designed to help you see how DailyFX utilizes the insights derived from IG Client Sentiment, and how client positioning can lead to trade ideas. If you have any questions on this indicator, you are welcome to reach out to the author of this article with questions at tyell@dailyfx.com.
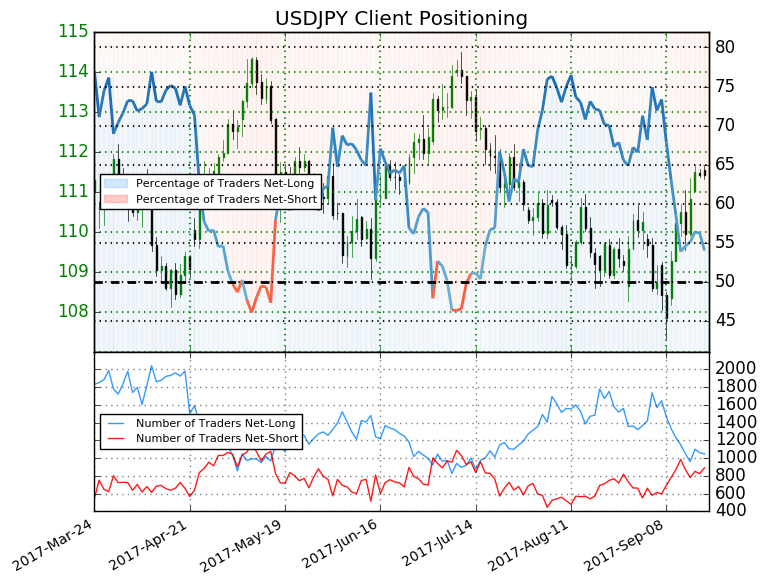
USDJPY: Retail trader data shows 66.2% of traders are net-long with the ratio of traders long to short at 1.96 to 1. In fact, traders have remained net-long since Jul 18 when USDJPY traded near 114.057; the price has moved 4.2% lower since then. The number of traders net-long is 5.5% lower than yesterday and 5.2% higher from last week, while the number of traders net-short is 14.5% higher than yesterday and 4.4% higher from last week.
We typically take a contrarian view to crowd sentiment, and the fact traders are net-long suggests USDJPY prices may continue to fall. Positioning is less net-long than yesterday but more net-long from last week. The combination of current sentiment and recent changes gives us a further mixed USDJPY trading bias (emphasis added.)
—
Written by Tyler Yell, CMT, Currency Analyst Trading Instructor for DailyFX.com
To receive Tyler’s analysis directly via email, please SIGN UP HERE
Contact and discuss markets with Tyler on Twitter: @ForexYell


What’s inside:
- EURUSD broke the ‘neckline’ of a bearish ‘head-and-shoulders’ pattern, April trend-line
- Resistance in vicinity of 11825/80 likely to keep a lid on further strength
- Targeting the low to mid-11600s with more selling
Confidence is essential to successful trading, see this new guide – ’Building Confidence in Trading’.
Coming into last week we pointed out the likelihood of finally seeing a resolution of the range EURUSD had been stuck in for the past few weeks, and one of the outcomes we made note of as a possibility was for the triggering of a ’head-and-shoulders’ pattern. Indeed, we saw a break of the ’neckline’ along with a drop below the April trend-line. This led to decent selling before a minor bounce took shape during the latter part of last week.
Looking ahead to next week the euro is set up for further losses as the path of least resistance has turned lower. Looking to a capper on any further strength there is resistance in the 11825-11880 area (old support becomes new resistance). As long as the euro stays below this area a downward bias will remain firmly intact.
Looking lower towards support eyes will be on the August low at 11662 and the 2016 high of 11616, of which the latter just happens to align almost precisely with the measured move target of the ‘head-and-shoulders’ pattern (determined by subtracting the height of the pattern from the neckline).
Bottom line: Shorts look set to have the upperhand as a fresh month gets underway as long as the euro remains capped by resistance. On weakness, we’ll be watching how the euro responds to a drop into support levels.
For a longer-term outlook on EURUSD, check out the just released Q4 Forecast.
EURUSD: Daily

—Written by Paul Robinson, Market Analyst
You can receive Paul’s analysis directly via email bysigning up here.
You can follow Paul on Twitter at@PaulRobinonFX.

Why and how do we use IG Client Sentiment in trading? See our guide and real-time data.
EURUSD: Retail trader data shows 37.3% of traders are net-long with the ratio of traders short to long at 1.68 to 1. In fact, traders have remained net-short since Apr 18 when EURUSD traded near 1.07831; price has moved 9.6% higher since then. The number of traders net-long is 15.4% lower than yesterday and 16.4% higher from last week, while the number of traders net-short is 0.4% higher than yesterday and 10.5% lower from last week.
We typically take a contrarian view to crowd sentiment, and the fact traders are net-short suggests EURUSD prices may continue to rise. Positioning is more net-short than yesterday but less net-short from last week. The combination of current sentiment and recent changes gives us a further mixed EURUSD trading bias.
— Written by Christopher Vecchio, CFA, Senior Currency Strategist
To contact Christopher Vecchio, e-mail cvecchio@dailyfx.com
Follow him on Twitter at @CVecchioFX
To be added to Christopher’s e-mail distribution list, please fill out this form

Why and how do we use IG Client Sentiment in trading? See our guide and real-time data.
GBPUSD: Retail trader data shows 38.2% of traders are net-long with the ratio of traders short to long at 1.62 to 1. In fact, traders have remained net-short since Sep 05 when GBPUSD traded near 1.29615; price has moved 3.4% higher since then. The number of traders net-long is 0.1% higher than yesterday and 13.4% higher from last week, while the number of traders net-short is 10.6% lower than yesterday and 18.3% lower from last week.
We typically take a contrarian view to crowd sentiment, and the fact traders are net-short suggests GBPUSD prices may continue to rise. Yet traders are less net-short than yesterday and compared with last week. Recent changes in sentiment warn that the current GBPUSD price trend may soon reverse lower despite the fact traders remain net-short.
— Written by Christopher Vecchio, CFA, Senior Currency Strategist
To contact Christopher Vecchio, e-mail cvecchio@dailyfx.com
Follow him on Twitter at @CVecchioFX
To be added to Christopher’s e-mail distribution list, please fill out this form
- Selling down on a ”deal”
- Oil product price pain is set to rise as the Strait of Hormuz stays closed into summer
- Brent crude up USD 9/bl on the week… ”deal around the corner” narrative fades
- Market Still Betting on Timely Resolution, But Each Day Raises Shortage Risk
- TACO (or Whatever It Was) Sends Oil Lower — Iran Keeps Choking Hormuz
-
Analys från DailyFX11 år ago
EUR/USD Flirts with Monthly Close Under 30 Year Trendline
-
Marknadsnyheter6 år ago
BrainCool AB (publ): erhåller bidrag (grant) om 0,9 MSEK från Vinnova för bolagets projekt inom behandling av covid-19 patienter med hög feber
-

 Marknadsnyheter3 år ago
Upptäck de bästa verktygen för att analysera Bitcoin!
-
Analys från DailyFX13 år ago
Japanese Yen Breakout or Fakeout? ZAR/JPY May Provide the Answer
-

 Marknadsnyheter3 år ago
Därför föredrar svenska spelare att spela via mobiltelefonen
-
Analys från DailyFX13 år ago
Price & Time: Key Levels to Watch in the Aftermath of NFP
-
Analys från DailyFX9 år ago
Gold Prices Falter at Resistance: Is the Bullish Run Finished?
-
 Nyheter8 år ago
Teknisk analys med Martin Hallström och Nils Brobacke