
Analys från DailyFX
USD/JPY Technical Analysis: Price Stalls At Long-Term Resistance
What can traders expect from USD/JPY in a year of US rate hikes?Here are our thoughts.
Talking Points:
- USD/JPY technical strategy: break 110.50 gives Bulls hope
- 200-DMA still acting as resistance, placing a lid on optimism for now
- IGCS continues to forecast bearish pressure on USD/JPY prices
After the Federal Reserve informed markets that they likely were not done hiking rates in 2017, and could continue the pace in 2018 of three hikes a year, USD/JPY has moved higher into long-term resistance. While yields on UST’s are lower and the Yield Curve is flattening, there remains reason to believe that the flattening yield curve caused by the front-end staying supported could also support the long-term uptrend in USD/JPY.
First, the front-end of the US Yield Curve Spread ( the difference between yields over two periods) is likely rising because the Fed is getting “free” rate hikes in the sense that they are hiking in an environment where lending conditions are getting easier, not tighter. Easy money conditions despite a tightening Fed is a similar environment to 2002-2006 when the Greenspan-led Fed hiked multiple times, which still provided enough “easy-money” to fuel the credit crisis of 2007-2009. The argument for easy money in a hiking environment can be seen in a few places. First, the Federal Reserve Bank of Chicago Lending Conditions is showing the easiest lending conditions since 2014, before the Fed started hiking. A similar index from Goldman Sachs is showing easy money, and lastly, the 10-year yield, a common basepoint for long-term loans is lower in the US than before the Fed began their tightening cycle in 2015.
Fundamentally, this sets up the technical picture well that we could see a steady–handed Fed that continues to hike and continues to lift the market for USD/JPY. Especially after the Bank of Japan failed to mention tapering at their recent post-rate announcement press conference.
When looking at the technical picture, you can see a few things on the daily chart and an important development on the shorter hourly chart. First, the daily chart is showing we’re still below the 200-DMA making it difficult to get too excited that the uptrend is back. You’ll notice the 200-DMA aligns with the Ichimoku cloud and prior Fibonacci resistance.
On the positive side, it’s worth noting a ‘base channel’ is acting as support that connects a late October high to the 2017 low. Also, on the short-term chart, we see 5-waves higher, which is an impulsive pattern per Elliott Wave that favors further upside after a three-wave correction. If an impulsive move is underway, I’d expect to see support near 110.66, before advancing higher. A break below 110.66 would open up an argument that the strong downtrend is still in play and not the potential reversal we’re watching to develop.
Join Tyler in his Daily Closing Bell webinars at 3 pm ET to discuss market developments.
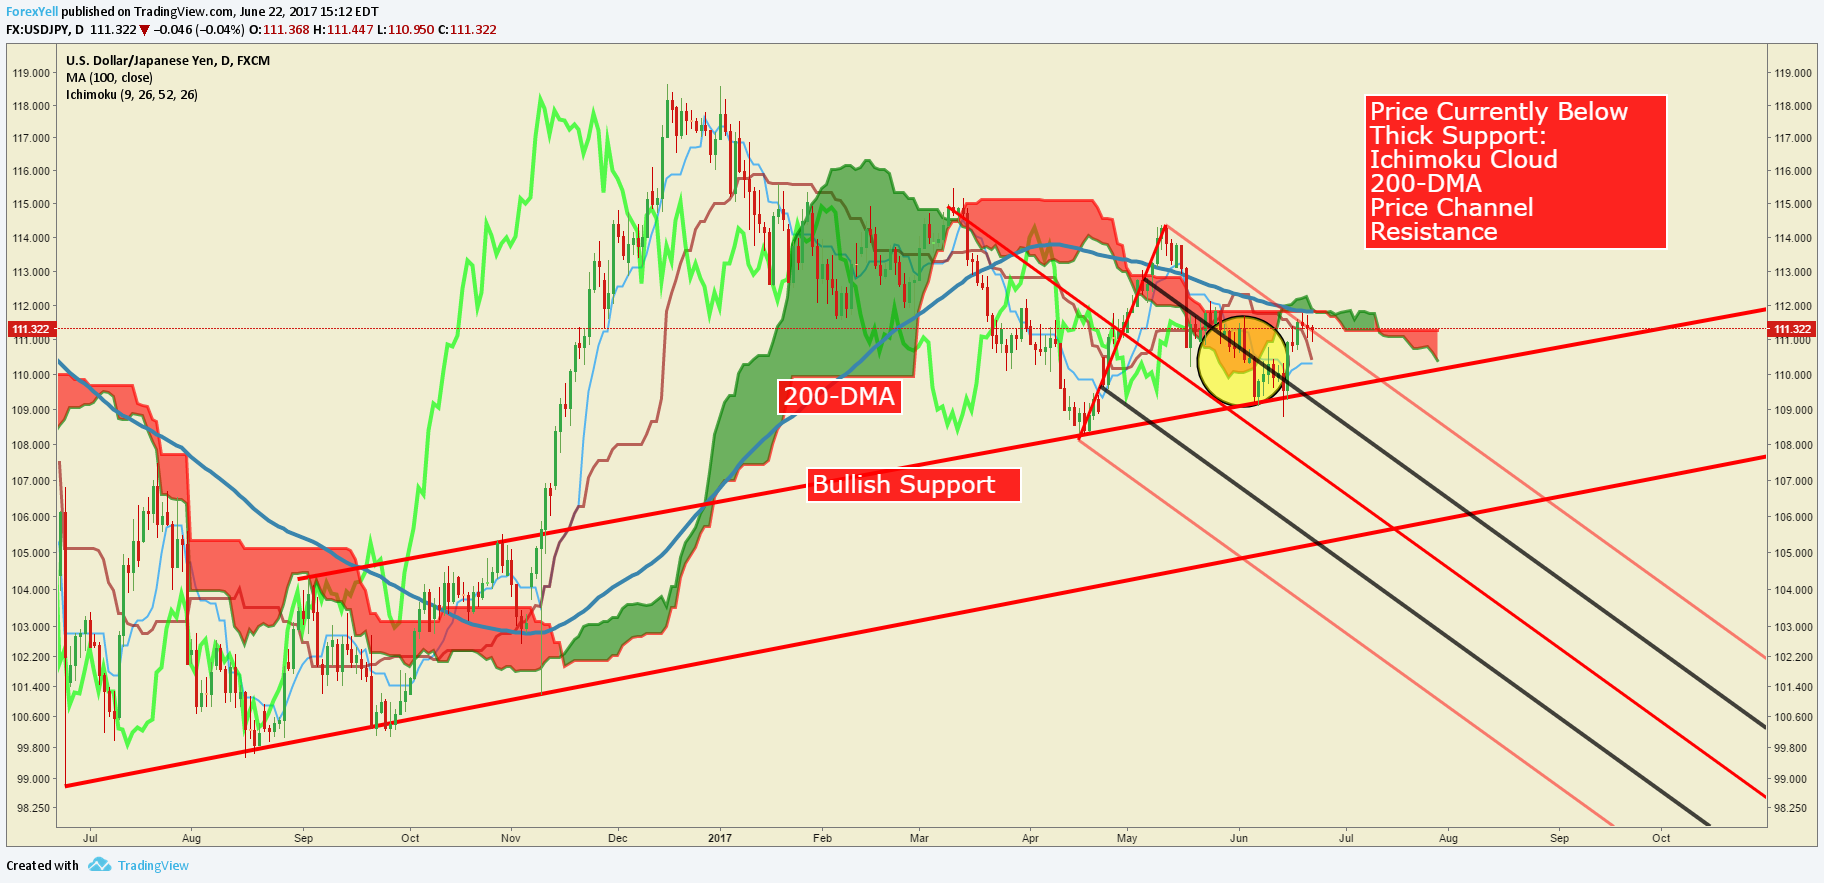
Chart Created by Tyler Yell, CMT
USD/JPY IG Trader Sentiment:Japanese Yen sentiment is balancing, helping support upside
What do retail traders’ buy/sell decisions hint about the JPY trend? Find out here!
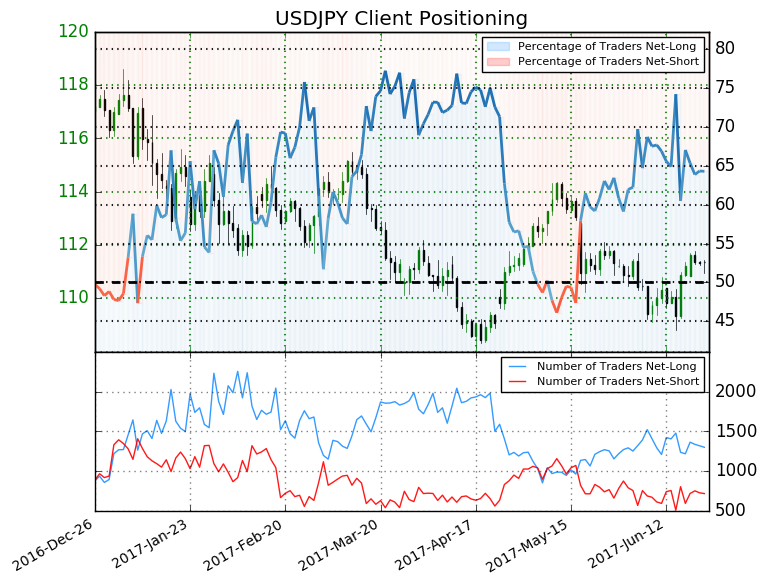
USDJPY: Retail trader data shows 64.3% of traders are net-long with the ratio of traders long to short at 1.8 to 1. In fact, traders have remained net-long since May 17 when USDJPY traded near 113.342; price has moved 1.8% lower since then. The number of traders net-long is 3.8% lower than yesterday and 3.1% lower from last week, while the number of traders net-short is 1.4% lower than yesterday and 11.1% higher from last week.
We typically take a contrarian view to crowd sentiment, and the fact traders are net-long suggests USDJPY prices may continue to fall. Yet traders are less net-long than yesterday and compared with last week. Recent changes in sentiment warn that the current USDJPY price trend may soon reverse higher despite the fact traders remain net-long.(Emphasis Mine)
—
Written by Tyler Yell, CMT, Currency Analyst Trading Instructor for DailyFX.com
To receive Tyler’s analysis directly via email, please SIGN UP HERE
Contact and discuss markets with Tyler on Twitter: @ForexYell


What’s inside:
- EURUSD broke the ‘neckline’ of a bearish ‘head-and-shoulders’ pattern, April trend-line
- Resistance in vicinity of 11825/80 likely to keep a lid on further strength
- Targeting the low to mid-11600s with more selling
Confidence is essential to successful trading, see this new guide – ’Building Confidence in Trading’.
Coming into last week we pointed out the likelihood of finally seeing a resolution of the range EURUSD had been stuck in for the past few weeks, and one of the outcomes we made note of as a possibility was for the triggering of a ’head-and-shoulders’ pattern. Indeed, we saw a break of the ’neckline’ along with a drop below the April trend-line. This led to decent selling before a minor bounce took shape during the latter part of last week.
Looking ahead to next week the euro is set up for further losses as the path of least resistance has turned lower. Looking to a capper on any further strength there is resistance in the 11825-11880 area (old support becomes new resistance). As long as the euro stays below this area a downward bias will remain firmly intact.
Looking lower towards support eyes will be on the August low at 11662 and the 2016 high of 11616, of which the latter just happens to align almost precisely with the measured move target of the ‘head-and-shoulders’ pattern (determined by subtracting the height of the pattern from the neckline).
Bottom line: Shorts look set to have the upperhand as a fresh month gets underway as long as the euro remains capped by resistance. On weakness, we’ll be watching how the euro responds to a drop into support levels.
For a longer-term outlook on EURUSD, check out the just released Q4 Forecast.
EURUSD: Daily

—Written by Paul Robinson, Market Analyst
You can receive Paul’s analysis directly via email bysigning up here.
You can follow Paul on Twitter at@PaulRobinonFX.

Why and how do we use IG Client Sentiment in trading? See our guide and real-time data.
EURUSD: Retail trader data shows 37.3% of traders are net-long with the ratio of traders short to long at 1.68 to 1. In fact, traders have remained net-short since Apr 18 when EURUSD traded near 1.07831; price has moved 9.6% higher since then. The number of traders net-long is 15.4% lower than yesterday and 16.4% higher from last week, while the number of traders net-short is 0.4% higher than yesterday and 10.5% lower from last week.
We typically take a contrarian view to crowd sentiment, and the fact traders are net-short suggests EURUSD prices may continue to rise. Positioning is more net-short than yesterday but less net-short from last week. The combination of current sentiment and recent changes gives us a further mixed EURUSD trading bias.
— Written by Christopher Vecchio, CFA, Senior Currency Strategist
To contact Christopher Vecchio, e-mail cvecchio@dailyfx.com
Follow him on Twitter at @CVecchioFX
To be added to Christopher’s e-mail distribution list, please fill out this form

Why and how do we use IG Client Sentiment in trading? See our guide and real-time data.
GBPUSD: Retail trader data shows 38.2% of traders are net-long with the ratio of traders short to long at 1.62 to 1. In fact, traders have remained net-short since Sep 05 when GBPUSD traded near 1.29615; price has moved 3.4% higher since then. The number of traders net-long is 0.1% higher than yesterday and 13.4% higher from last week, while the number of traders net-short is 10.6% lower than yesterday and 18.3% lower from last week.
We typically take a contrarian view to crowd sentiment, and the fact traders are net-short suggests GBPUSD prices may continue to rise. Yet traders are less net-short than yesterday and compared with last week. Recent changes in sentiment warn that the current GBPUSD price trend may soon reverse lower despite the fact traders remain net-short.
— Written by Christopher Vecchio, CFA, Senior Currency Strategist
To contact Christopher Vecchio, e-mail cvecchio@dailyfx.com
Follow him on Twitter at @CVecchioFX
To be added to Christopher’s e-mail distribution list, please fill out this form
-
Analys från DailyFX8 år ago
EUR/USD Flirts with Monthly Close Under 30 Year Trendline
-

 Marknadsnyheter1 år ago
Upptäck de bästa verktygen för att analysera Bitcoin!
-
Marknadsnyheter4 år ago
BrainCool AB (publ): erhåller bidrag (grant) om 0,9 MSEK från Vinnova för bolagets projekt inom behandling av covid-19 patienter med hög feber
-
Analys från DailyFX11 år ago
Japanese Yen Breakout or Fakeout? ZAR/JPY May Provide the Answer
-
Analys från DailyFX11 år ago
Price & Time: Key Levels to Watch in the Aftermath of NFP
-
Analys från DailyFX7 år ago
Gold Prices Falter at Resistance: Is the Bullish Run Finished?
-
 Nyheter5 år ago
Teknisk analys med Martin Hallström och Nils Brobacke
-
Marknadsnyheter6 år ago
Tudorza reduces exacerbations and demonstrates cardiovascular safety in COPD patients