
Analys från DailyFX
Japanese Yen Technical Analysis: Year’s Lows Creep Back Into Focus
Talking Points
- After a long period of dominance, the Yen is returning some of its gains
- The US Dollar has been a clear beneficiary, with the downtrend from this year’s peaks broken
- The New Zealand Dollar has done well too, but seems to be taking a breath
Just getting started in the trading world? Our beginners’ guide is here to help
The Japanese Yen looks to be in more trouble against the US Dollar than it has been for quite some time.
Ten of the last thirteen trading days have seen USD/JPY gain, snapping in the process its long downtrend from July 11’s peak. The pair’s steep climb since September 8 has seen it scale peaks not seen since mid-July.
The fundamental backdrop for this surge of vigor is not hard to pin down. Tensions over North Korea appear to have eased, global risk appetite has been revived and the chasm between tightening US monetary policy and Japan’s uber-looseness continues to yawn.
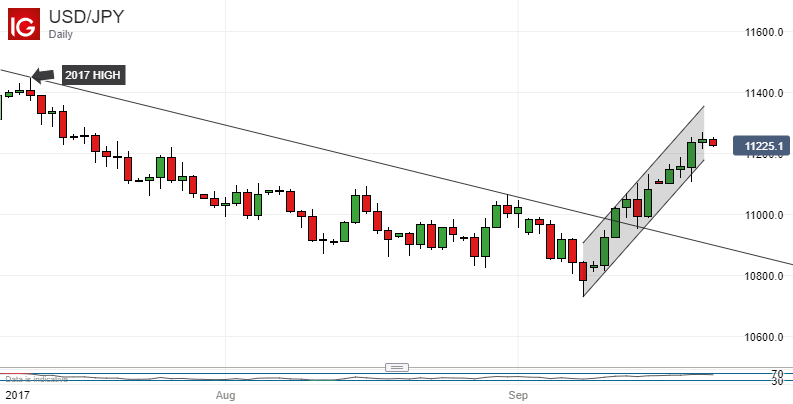
The question now of course is how far can USD/JPY go. Some pause for consolidation would seem to be in order, but a look at the pair’s momentum indicators does not yet suggest much overbuying at all, never mind the sort of extreme enthusiasm which might argue for a pause.
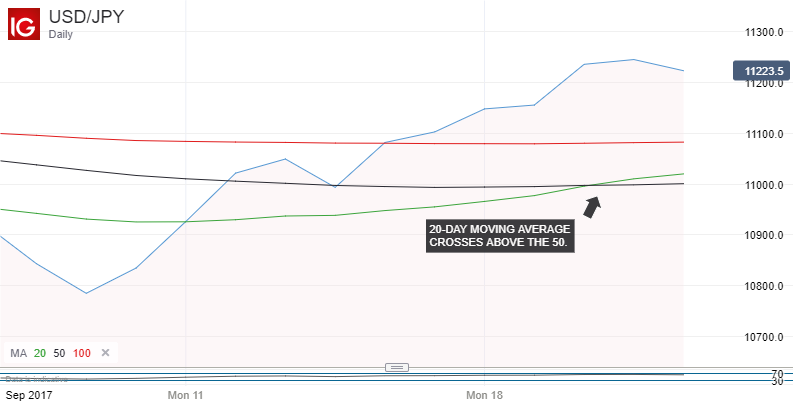
USD/JPY is now above its 20-, 50- and 100-day moving averages, but the 20-day crossed above the 50 on September 20. This is usually considered to be a pretty bullish signal and suggests that the pair has more to give bulls yet.
Immediate upside levels to conjure with on the daily chart look like July 12’s close of 112.59 and July 13’s 113.36.
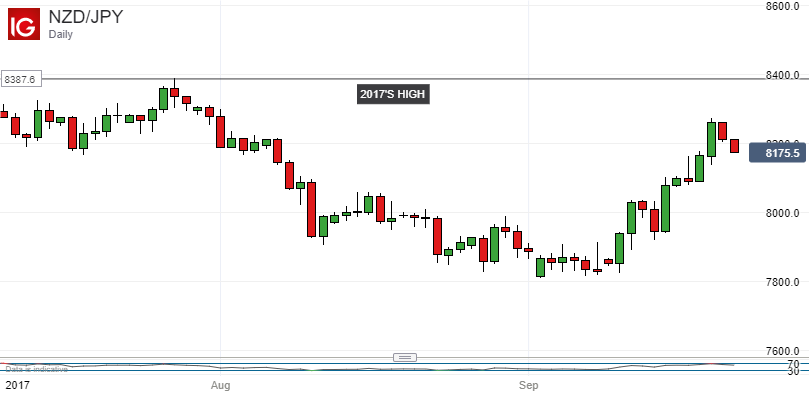
Meanwhile the New Zealand Dollar has also staged an impressive bounce against the Japanese Yen this month, a month which started with the kiwi in a spot of trouble, at least as far as bulls were concerned. However, the latest rise seems to have petered out some way short of July’s 2017 high. This may be down to general jitters around the New Zealand currency ahead of this weekend’s general election, in the face of neck-and-neck polling and an uncertain coalition prospect.
It may this be too early to call current price action a definitive lower high, and the uncommitted could be well-advised to await the election result.
— Written by David Cottle, DailyFX Research
Contact and follow David on Twitter:@DavidCottleFX


What’s inside:
- EURUSD broke the ‘neckline’ of a bearish ‘head-and-shoulders’ pattern, April trend-line
- Resistance in vicinity of 11825/80 likely to keep a lid on further strength
- Targeting the low to mid-11600s with more selling
Confidence is essential to successful trading, see this new guide – ’Building Confidence in Trading’.
Coming into last week we pointed out the likelihood of finally seeing a resolution of the range EURUSD had been stuck in for the past few weeks, and one of the outcomes we made note of as a possibility was for the triggering of a ’head-and-shoulders’ pattern. Indeed, we saw a break of the ’neckline’ along with a drop below the April trend-line. This led to decent selling before a minor bounce took shape during the latter part of last week.
Looking ahead to next week the euro is set up for further losses as the path of least resistance has turned lower. Looking to a capper on any further strength there is resistance in the 11825-11880 area (old support becomes new resistance). As long as the euro stays below this area a downward bias will remain firmly intact.
Looking lower towards support eyes will be on the August low at 11662 and the 2016 high of 11616, of which the latter just happens to align almost precisely with the measured move target of the ‘head-and-shoulders’ pattern (determined by subtracting the height of the pattern from the neckline).
Bottom line: Shorts look set to have the upperhand as a fresh month gets underway as long as the euro remains capped by resistance. On weakness, we’ll be watching how the euro responds to a drop into support levels.
For a longer-term outlook on EURUSD, check out the just released Q4 Forecast.
EURUSD: Daily

—Written by Paul Robinson, Market Analyst
You can receive Paul’s analysis directly via email bysigning up here.
You can follow Paul on Twitter at@PaulRobinonFX.

Why and how do we use IG Client Sentiment in trading? See our guide and real-time data.
EURUSD: Retail trader data shows 37.3% of traders are net-long with the ratio of traders short to long at 1.68 to 1. In fact, traders have remained net-short since Apr 18 when EURUSD traded near 1.07831; price has moved 9.6% higher since then. The number of traders net-long is 15.4% lower than yesterday and 16.4% higher from last week, while the number of traders net-short is 0.4% higher than yesterday and 10.5% lower from last week.
We typically take a contrarian view to crowd sentiment, and the fact traders are net-short suggests EURUSD prices may continue to rise. Positioning is more net-short than yesterday but less net-short from last week. The combination of current sentiment and recent changes gives us a further mixed EURUSD trading bias.
— Written by Christopher Vecchio, CFA, Senior Currency Strategist
To contact Christopher Vecchio, e-mail cvecchio@dailyfx.com
Follow him on Twitter at @CVecchioFX
To be added to Christopher’s e-mail distribution list, please fill out this form

Why and how do we use IG Client Sentiment in trading? See our guide and real-time data.
GBPUSD: Retail trader data shows 38.2% of traders are net-long with the ratio of traders short to long at 1.62 to 1. In fact, traders have remained net-short since Sep 05 when GBPUSD traded near 1.29615; price has moved 3.4% higher since then. The number of traders net-long is 0.1% higher than yesterday and 13.4% higher from last week, while the number of traders net-short is 10.6% lower than yesterday and 18.3% lower from last week.
We typically take a contrarian view to crowd sentiment, and the fact traders are net-short suggests GBPUSD prices may continue to rise. Yet traders are less net-short than yesterday and compared with last week. Recent changes in sentiment warn that the current GBPUSD price trend may soon reverse lower despite the fact traders remain net-short.
— Written by Christopher Vecchio, CFA, Senior Currency Strategist
To contact Christopher Vecchio, e-mail cvecchio@dailyfx.com
Follow him on Twitter at @CVecchioFX
To be added to Christopher’s e-mail distribution list, please fill out this form
- Crude stocks fall again – diesel tightness persists
- Increasing risk that OPEC+ will unwind the last 1.65 mb/d of cuts when they meet on 7 September
- Brent edges higher as India–Russia oil trade draws U.S. ire and Powell takes the stage at Jackson Hole
- Brent sideways on sanctions and peace talks
- Crude inventories builds, diesel remain low
-
Analys från DailyFX10 år ago
EUR/USD Flirts with Monthly Close Under 30 Year Trendline
-
Marknadsnyheter5 år ago
BrainCool AB (publ): erhåller bidrag (grant) om 0,9 MSEK från Vinnova för bolagets projekt inom behandling av covid-19 patienter med hög feber
-

 Marknadsnyheter3 år ago
Upptäck de bästa verktygen för att analysera Bitcoin!
-
Analys från DailyFX12 år ago
Japanese Yen Breakout or Fakeout? ZAR/JPY May Provide the Answer
-

 Marknadsnyheter2 år ago
Därför föredrar svenska spelare att spela via mobiltelefonen
-
Analys från DailyFX12 år ago
Price & Time: Key Levels to Watch in the Aftermath of NFP
-
Analys från DailyFX8 år ago
Gold Prices Falter at Resistance: Is the Bullish Run Finished?
-
 Nyheter7 år ago
Teknisk analys med Martin Hallström och Nils Brobacke