
Analys från DailyFX
ASX 200 Technical Analysis: Still Stuck In That Winter Ice
Talking Points:
- The ASX 200 remains pinned in a very narrow range
- There’s been a decent amount of volatility within it
- But there’s still little sign of an imminent break
Check out retail investors’ feelings about the currencies you like, and those you don’t, at the DailyFX Sentiment Guide
A cold winter may not be the first thing which springs to mind when you think about balmy, South Pacific Australia, but its premier equity index has just endured one.
Northern hemisphere supremacists should bear in mind that their summer is Aussie winter, and that the ASX 200 has been stuck in a bare, 160-point range throughout. The long freeze began when modest retreat from 2017’s highs accelerated back in mid-May. The fall through 5809 marked what would become a range top which has endured ever since. The bottom of the range is 5646, plumbed on June 8.
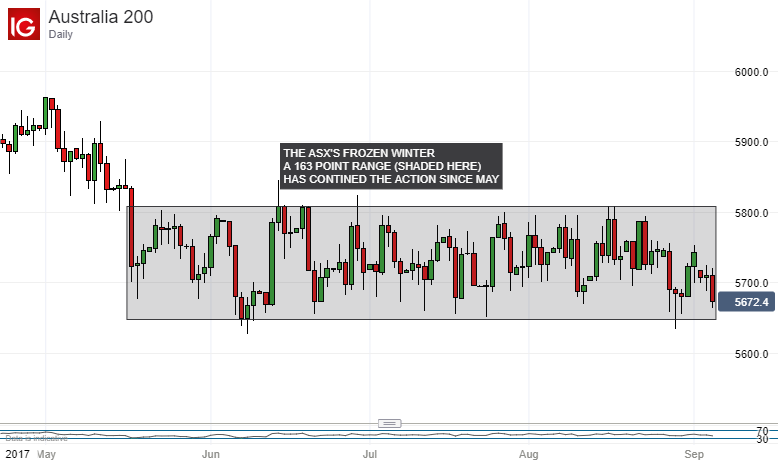
Yes, there have been occasional intraday pokes beyond these bounds, both up and down. But on a daily-closing basis they have contained all the action to this day. It’s notable too that neither the base nor the peak of the range has been seriously threatened on a daily close since June. In other words, this range looks remarkably well entrenched.
So, is anything about to change?
Well, the ASX is apparently inching towards the bottom again but it’s probably just too coincidental that it should be doing so at a time when North Korea’s nuclear ambitions are making equity overall very jittery. Assuming we reach the now customary period of calm between Pyongyang’s provocations it seems reasonable to further assume that the ASX base will in fact hold once more.
Admittedly the index posted a rare, clear “lower high” just last week. It appears to have topped out at 5742 on Friday, below the last significant peak of 5786 hit on August 22. But this process also looks as though it might be Korea-related. There was certainly no sign of a significant shift in either moving averages or momentum indicators which might portend anything more serious.

All up if you’ve been playing the ASX range all winter and liking it, there’s probably no reason to stop. On the other hand, if you’re looking for a compelling reason to go definitively long or short right now, it’s tough to spot one on the charts.
— Written by David Cottle, DailyFX Research
Contact and follow David on Twitter:@DavidCottleFX


What’s inside:
- EURUSD broke the ‘neckline’ of a bearish ‘head-and-shoulders’ pattern, April trend-line
- Resistance in vicinity of 11825/80 likely to keep a lid on further strength
- Targeting the low to mid-11600s with more selling
Confidence is essential to successful trading, see this new guide – ’Building Confidence in Trading’.
Coming into last week we pointed out the likelihood of finally seeing a resolution of the range EURUSD had been stuck in for the past few weeks, and one of the outcomes we made note of as a possibility was for the triggering of a ’head-and-shoulders’ pattern. Indeed, we saw a break of the ’neckline’ along with a drop below the April trend-line. This led to decent selling before a minor bounce took shape during the latter part of last week.
Looking ahead to next week the euro is set up for further losses as the path of least resistance has turned lower. Looking to a capper on any further strength there is resistance in the 11825-11880 area (old support becomes new resistance). As long as the euro stays below this area a downward bias will remain firmly intact.
Looking lower towards support eyes will be on the August low at 11662 and the 2016 high of 11616, of which the latter just happens to align almost precisely with the measured move target of the ‘head-and-shoulders’ pattern (determined by subtracting the height of the pattern from the neckline).
Bottom line: Shorts look set to have the upperhand as a fresh month gets underway as long as the euro remains capped by resistance. On weakness, we’ll be watching how the euro responds to a drop into support levels.
For a longer-term outlook on EURUSD, check out the just released Q4 Forecast.
EURUSD: Daily

—Written by Paul Robinson, Market Analyst
You can receive Paul’s analysis directly via email bysigning up here.
You can follow Paul on Twitter at@PaulRobinonFX.

Why and how do we use IG Client Sentiment in trading? See our guide and real-time data.
EURUSD: Retail trader data shows 37.3% of traders are net-long with the ratio of traders short to long at 1.68 to 1. In fact, traders have remained net-short since Apr 18 when EURUSD traded near 1.07831; price has moved 9.6% higher since then. The number of traders net-long is 15.4% lower than yesterday and 16.4% higher from last week, while the number of traders net-short is 0.4% higher than yesterday and 10.5% lower from last week.
We typically take a contrarian view to crowd sentiment, and the fact traders are net-short suggests EURUSD prices may continue to rise. Positioning is more net-short than yesterday but less net-short from last week. The combination of current sentiment and recent changes gives us a further mixed EURUSD trading bias.
— Written by Christopher Vecchio, CFA, Senior Currency Strategist
To contact Christopher Vecchio, e-mail cvecchio@dailyfx.com
Follow him on Twitter at @CVecchioFX
To be added to Christopher’s e-mail distribution list, please fill out this form

Why and how do we use IG Client Sentiment in trading? See our guide and real-time data.
GBPUSD: Retail trader data shows 38.2% of traders are net-long with the ratio of traders short to long at 1.62 to 1. In fact, traders have remained net-short since Sep 05 when GBPUSD traded near 1.29615; price has moved 3.4% higher since then. The number of traders net-long is 0.1% higher than yesterday and 13.4% higher from last week, while the number of traders net-short is 10.6% lower than yesterday and 18.3% lower from last week.
We typically take a contrarian view to crowd sentiment, and the fact traders are net-short suggests GBPUSD prices may continue to rise. Yet traders are less net-short than yesterday and compared with last week. Recent changes in sentiment warn that the current GBPUSD price trend may soon reverse lower despite the fact traders remain net-short.
— Written by Christopher Vecchio, CFA, Senior Currency Strategist
To contact Christopher Vecchio, e-mail cvecchio@dailyfx.com
Follow him on Twitter at @CVecchioFX
To be added to Christopher’s e-mail distribution list, please fill out this form
-
Analys från DailyFX8 år ago
EUR/USD Flirts with Monthly Close Under 30 Year Trendline
-

 Marknadsnyheter1 år ago
Upptäck de bästa verktygen för att analysera Bitcoin!
-
Marknadsnyheter4 år ago
BrainCool AB (publ): erhåller bidrag (grant) om 0,9 MSEK från Vinnova för bolagets projekt inom behandling av covid-19 patienter med hög feber
-
Analys från DailyFX11 år ago
Japanese Yen Breakout or Fakeout? ZAR/JPY May Provide the Answer
-
Analys från DailyFX11 år ago
Price & Time: Key Levels to Watch in the Aftermath of NFP
-
Analys från DailyFX7 år ago
Gold Prices Falter at Resistance: Is the Bullish Run Finished?
-
 Nyheter5 år ago
Teknisk analys med Martin Hallström och Nils Brobacke
-
Marknadsnyheter6 år ago
Tudorza reduces exacerbations and demonstrates cardiovascular safety in COPD patients