
Analys från DailyFX
Dollar Index Fails to Show Definitive Reversal Signs Ahead of FOMC
Talking Points:
- DXY Technical Strategy: DXY remains in “sell the rips” mode below 94.08
- DXY appears to be bouncing off an extreme downside target, may be subject to month-end flows
- Fed Funds Future bets take the probability of a Fed hike in 2017 down to 1/3
- IG Client Sentiment Highlight: EUR/USD (57.6% of DXY) sentiment favors further push higher
The Dollar Index has pushed off the lows for 2017 that wastraded at earlier in the month at 91.01. The technical level of focus that traders should keep in their sights is the March 2009 high of 89.62. The 89.62 level markets the March 2009 high (seen on the weekly chart below. A break below this level would open up the breakdown/ overlap of prior price patterns.
From a price structure view, an overlap tends to indicate lack of long-term upside. A hold of support at 89.62 would favor the view that we could still be within a multi-year DXY bull market. A break below 89.62 would make the argument that we are within a larger downtrend for the US Dollar Index.
Weekly DXY Chart: Break below March 2009 High Would Eliminate LT DXY Bull View
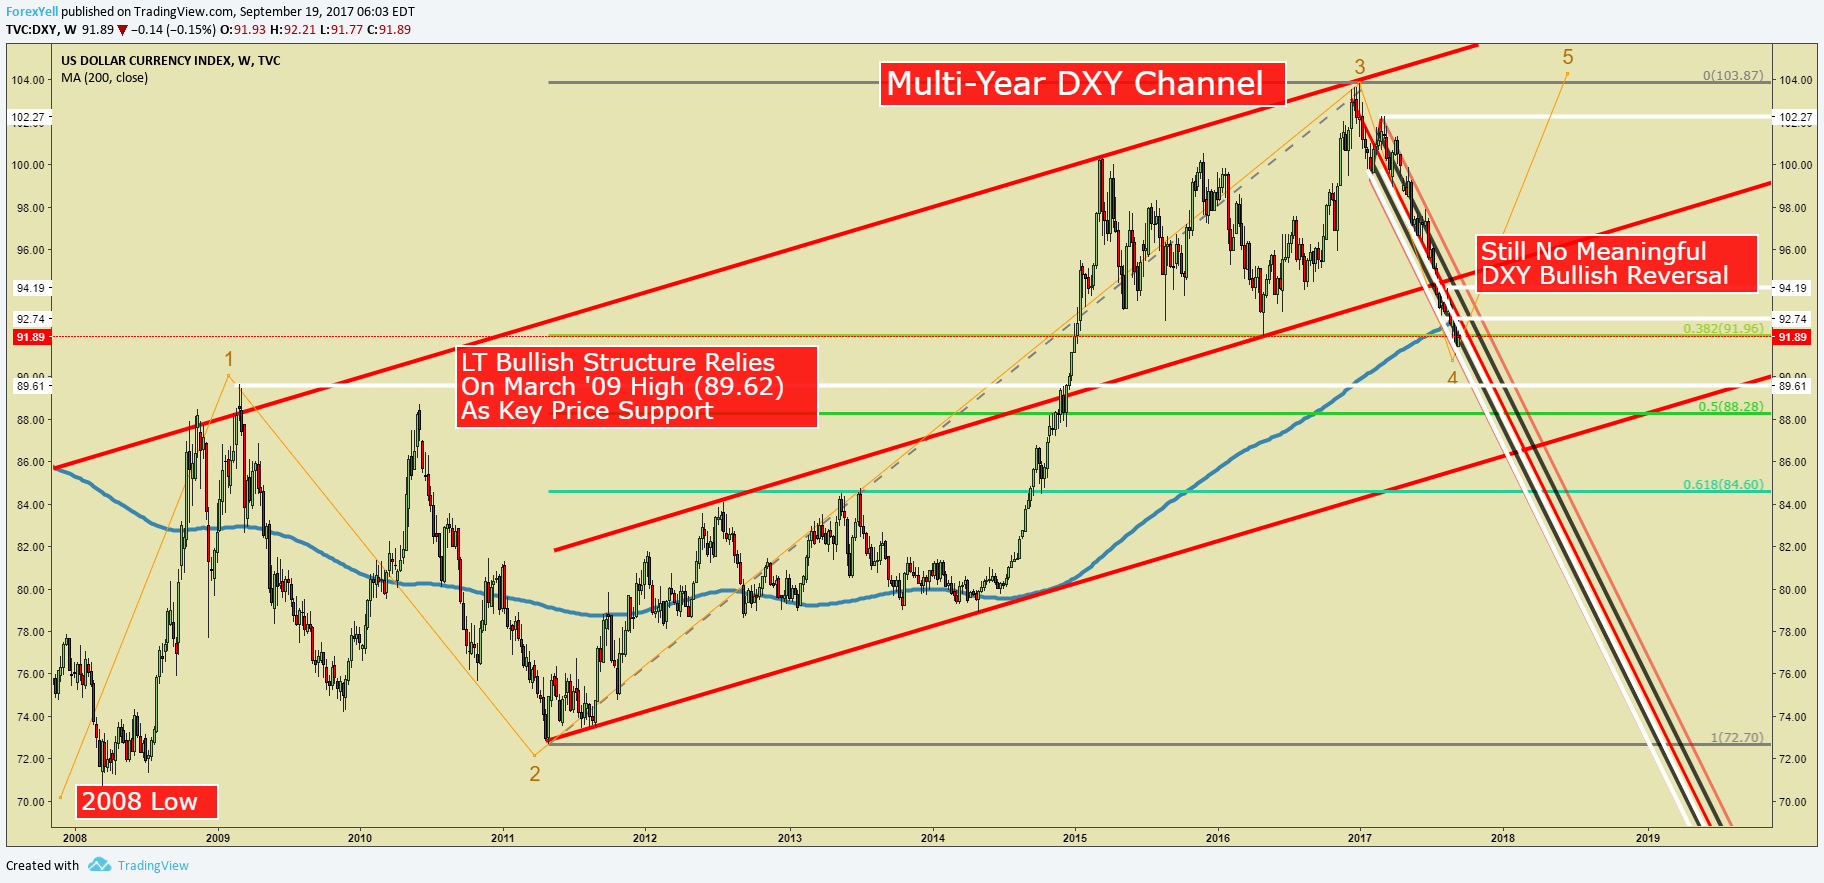
Chart by Tyler Yell, CMT
The chart above shows the US Dollar Index from the 2008 low up to the January 2017 high. 2017 has seen a ~12% drop in the Dollar Index, but traders have not known whether or not the price drop has been a sharp correction within a broader Bull market that would be expected to continue higher or whether we are in the midst of a multi-year move lower in the USD. I continue to favor the latter view.
We can look to different components of the chart to help guide us from here. First, until the bearish channel of 2017 (falling red channel) on the chart above and below fails to hold a price breakout, the bias will be for further US Dollar index weakness. The overall bias for swing trading is to sell strength or on a breakdown below a lower high. There has been a consolidation higher, but momentum favors further weakness until material strength is seen as evidence of a channel breakout while holding the March 2009 high as support.
Daily DXY Chart: Dollar Index Momentum favors Bearish Continuation
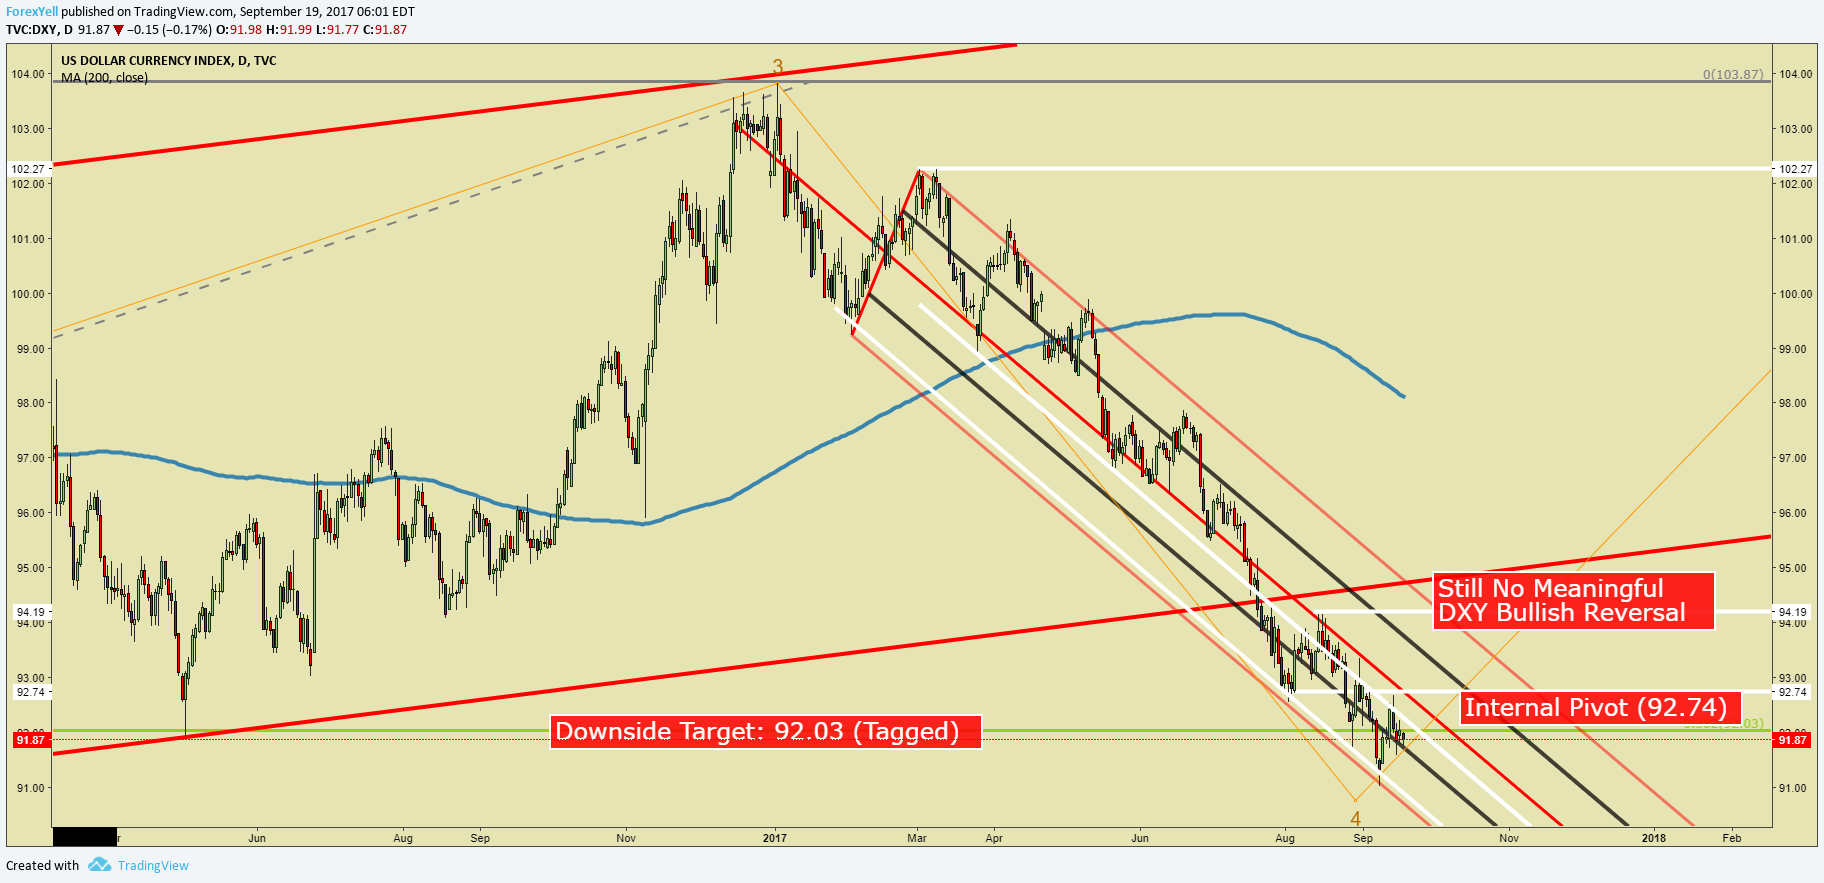
Chart by Tyler Yell, CMT
The daily chart above puts focus on internal pivots to help guide your bias and trading. Initial resistance can be found at 92.68/74. Though price recently broke through focal support, there are not enough signs that a base is in place. On Wednesday, the Federal Reserve will announce their rate decision, which is widely expected to remain at the current 1% level. The focus of the FOMC decision is whether or not the famous DOT plot, where Federal Reserve voters anonymously place a vote for where they see the reference rate through 2020, is lowered.
Want to learn how to trade from our experts? We recently updated and added new trading guides here.
From a sentiment perspective, we are seeing a stretched DXY short position. However, an aggressive short position is not enough to trigger a buy signal. IG Client Sentiment helps us to see retail sentiment best through EUR/USD, which is 57.6% of DXY. Other position indicators like the Daily Sentiment Index (DSI) show the bearish positioning of DXY near extreme levels at 17% Bulls as of Monday’s close. That means there is a short-covering risk if the FOMC result is a hawkish surprise that would send DXY higher. However, the trend is there for a reason, and if nothing surprises positively for the US Economy, the upside will likely come from ECB rhetoric talking down their currency giving the USD a boost, but likely, not a definitive trend change.
If you would be interested in seeing how retail traders’ are betting key markets, see IG Client Sentiment here!
Join Tyler in his Daily Closing Bell webinars at 3 pm ET to discuss this market.
IG Client Sentiment Highlight: EUR (57.6% of DXY) sentiment favors further upside in EUR/USD
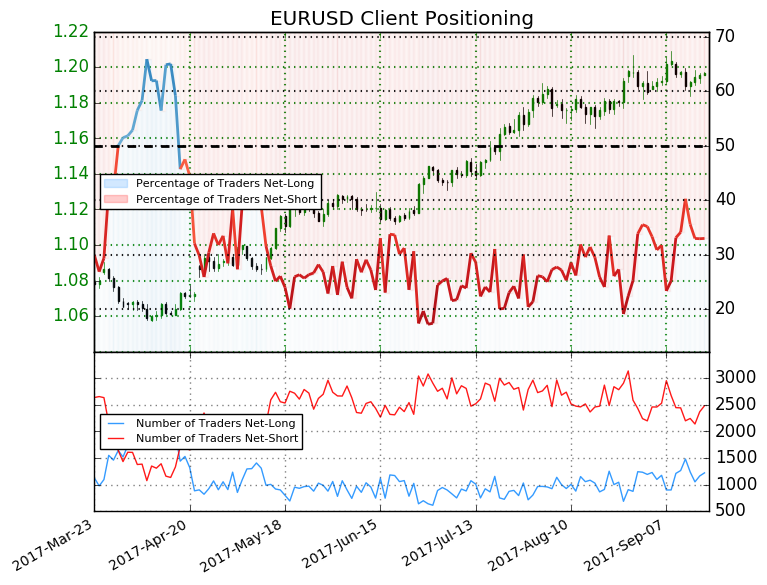
EURUSD: Retail trader data shows 33.0% of traders are net-long with the ratio of traders short to long at 2.03 to 1. In fact, traders have remained net-short since Apr 18 when EURUSD traded near 1.08475; theprice has moved 10.5% higher since then. The number of traders net-long is 7.4% higher than yesterday and 3.2% lower from last week, while the number of traders net-short is 10.8% higher than yesterday and 1.6% higher from last week.
We typically take a contrarian view to crowd sentiment, and the fact traders are net-short suggests EURUSD prices may continue to rise. Traders are further net-short than yesterday and last week, and the combination of current sentiment and recent changes gives us a stronger EURUSD-bullish contrarian trading bias (emphasis mine).
—
Written by Tyler Yell, CMT, Currency Analyst Trading Instructor for DailyFX.com
To receive Tyler’s analysis directly via email, please SIGN UP HERE
Contact and discuss markets with Tyler on Twitter: @ForexYell


What’s inside:
- EURUSD broke the ‘neckline’ of a bearish ‘head-and-shoulders’ pattern, April trend-line
- Resistance in vicinity of 11825/80 likely to keep a lid on further strength
- Targeting the low to mid-11600s with more selling
Confidence is essential to successful trading, see this new guide – ’Building Confidence in Trading’.
Coming into last week we pointed out the likelihood of finally seeing a resolution of the range EURUSD had been stuck in for the past few weeks, and one of the outcomes we made note of as a possibility was for the triggering of a ’head-and-shoulders’ pattern. Indeed, we saw a break of the ’neckline’ along with a drop below the April trend-line. This led to decent selling before a minor bounce took shape during the latter part of last week.
Looking ahead to next week the euro is set up for further losses as the path of least resistance has turned lower. Looking to a capper on any further strength there is resistance in the 11825-11880 area (old support becomes new resistance). As long as the euro stays below this area a downward bias will remain firmly intact.
Looking lower towards support eyes will be on the August low at 11662 and the 2016 high of 11616, of which the latter just happens to align almost precisely with the measured move target of the ‘head-and-shoulders’ pattern (determined by subtracting the height of the pattern from the neckline).
Bottom line: Shorts look set to have the upperhand as a fresh month gets underway as long as the euro remains capped by resistance. On weakness, we’ll be watching how the euro responds to a drop into support levels.
For a longer-term outlook on EURUSD, check out the just released Q4 Forecast.
EURUSD: Daily

—Written by Paul Robinson, Market Analyst
You can receive Paul’s analysis directly via email bysigning up here.
You can follow Paul on Twitter at@PaulRobinonFX.

Why and how do we use IG Client Sentiment in trading? See our guide and real-time data.
EURUSD: Retail trader data shows 37.3% of traders are net-long with the ratio of traders short to long at 1.68 to 1. In fact, traders have remained net-short since Apr 18 when EURUSD traded near 1.07831; price has moved 9.6% higher since then. The number of traders net-long is 15.4% lower than yesterday and 16.4% higher from last week, while the number of traders net-short is 0.4% higher than yesterday and 10.5% lower from last week.
We typically take a contrarian view to crowd sentiment, and the fact traders are net-short suggests EURUSD prices may continue to rise. Positioning is more net-short than yesterday but less net-short from last week. The combination of current sentiment and recent changes gives us a further mixed EURUSD trading bias.
— Written by Christopher Vecchio, CFA, Senior Currency Strategist
To contact Christopher Vecchio, e-mail cvecchio@dailyfx.com
Follow him on Twitter at @CVecchioFX
To be added to Christopher’s e-mail distribution list, please fill out this form

Why and how do we use IG Client Sentiment in trading? See our guide and real-time data.
GBPUSD: Retail trader data shows 38.2% of traders are net-long with the ratio of traders short to long at 1.62 to 1. In fact, traders have remained net-short since Sep 05 when GBPUSD traded near 1.29615; price has moved 3.4% higher since then. The number of traders net-long is 0.1% higher than yesterday and 13.4% higher from last week, while the number of traders net-short is 10.6% lower than yesterday and 18.3% lower from last week.
We typically take a contrarian view to crowd sentiment, and the fact traders are net-short suggests GBPUSD prices may continue to rise. Yet traders are less net-short than yesterday and compared with last week. Recent changes in sentiment warn that the current GBPUSD price trend may soon reverse lower despite the fact traders remain net-short.
— Written by Christopher Vecchio, CFA, Senior Currency Strategist
To contact Christopher Vecchio, e-mail cvecchio@dailyfx.com
Follow him on Twitter at @CVecchioFX
To be added to Christopher’s e-mail distribution list, please fill out this form
- Brent crude up USD 9/bl on the week… ”deal around the corner” narrative fades
- Market Still Betting on Timely Resolution, But Each Day Raises Shortage Risk
- TACO (or Whatever It Was) Sends Oil Lower — Iran Keeps Choking Hormuz
- Oil stress is rising as the supply chains and buffers are drained
- Buy Brent Dec-2026 calls with strike $150/b!
-
Analys från DailyFX10 år ago
EUR/USD Flirts with Monthly Close Under 30 Year Trendline
-
Marknadsnyheter6 år ago
BrainCool AB (publ): erhåller bidrag (grant) om 0,9 MSEK från Vinnova för bolagets projekt inom behandling av covid-19 patienter med hög feber
-

 Marknadsnyheter3 år ago
Upptäck de bästa verktygen för att analysera Bitcoin!
-
Analys från DailyFX13 år ago
Japanese Yen Breakout or Fakeout? ZAR/JPY May Provide the Answer
-

 Marknadsnyheter3 år ago
Därför föredrar svenska spelare att spela via mobiltelefonen
-
Analys från DailyFX13 år ago
Price & Time: Key Levels to Watch in the Aftermath of NFP
-
Analys från DailyFX9 år ago
Gold Prices Falter at Resistance: Is the Bullish Run Finished?
-
 Nyheter7 år ago
Teknisk analys med Martin Hallström och Nils Brobacke