
Analys från DailyFX
GBP/USD Technical Analysis: Bull Flag, Deeper Retracement Potential
Talking Points:
– The British Pound put in an aggressively bullish move around last week’s BoE rate decision, and is seeing a bit of retracement to start this week after a speech from BoE Governor, Mark Carney.
– With the recent bout of GBP strength we’ve seen a rise in retail sellers. IG Client Sentiment sits at -2.46 as of this writing, and given retail trader’s traditional contrarian nature, this is bullish for the pair.
– Want to see how GBP and USD have held up to our DailyFX Forecasts? Click here for full access.
To receive James Stanley’s Analysis directly via email, please sign up here.
In our last article, we looked at higher-low support in GBP/USD after the BoE-fueled bullish breakout. At the BoE rate decision earlier in the month, the bank warned that near-term rate hikes may be on the horizon as inflation remains rather elevated in the U.K. economy. This led to a brisk breakout as Cable broke-out to a fresh one-year high, with resistance finally beginning to set-in around the 1.3600 handle.
Shortly after that bullish breakout, and as we discussed in our previous article, BoE Governor Mark Carney tried to tap the brakes on that theme, as he remarked that any rate hikes would likely be limited and gradual. This dented that bullish move, albeit temporarily, as price action found support at a key level of 1.3478. This is the 50% retracement of the ‘Brexit move’ in the pair, and that support held for most of last week before prices finally started to slide below yesterday.
After numerous tests of that support last week, bears are finally grabbing control of short-term price action and, when the near-term lower-lows are combined with the lower-highs that have started to show-up, this brings on a bull flag formation as we have a short-term descending channel as a retracement in the longer-term bullish move.
GBP/USD Four-Hour: Bull Flag Develops with Lower-Lows, Highs

Chart prepared by James Stanley
This short-term bull flag helps to highlight how shallow the retracement has been thus far, at least in terms of the bullish move that started two weeks ago. At this stage, we’ve retraced less than 30% of that move, and given that bulls have shown little response to these deeper support tests below 1.3478, it would appear as though a deeper retracement may be in the cards.
In our last article, we noted two areas that could be attractive for such a scenario, around 1.3350 and 1.3250. If we apply a Fibonacci retracement to this most recent bullish move, taking the August low up to the September high, we can see where each of those prices falls near a retracement level of relevance. The 38.2% retracement of that move comes-in at 1.3321, and the 50% retracement is at 1.3217. These levels can be incorporated to produce support zones with which traders can follow in the effort of trading the longer-term, bullish continuation theme in GBP/USD.
GBP/USD Hourly: Short-Term Fibonacci Retracement Applied, Emphasis on 38.2%, 50% Levels
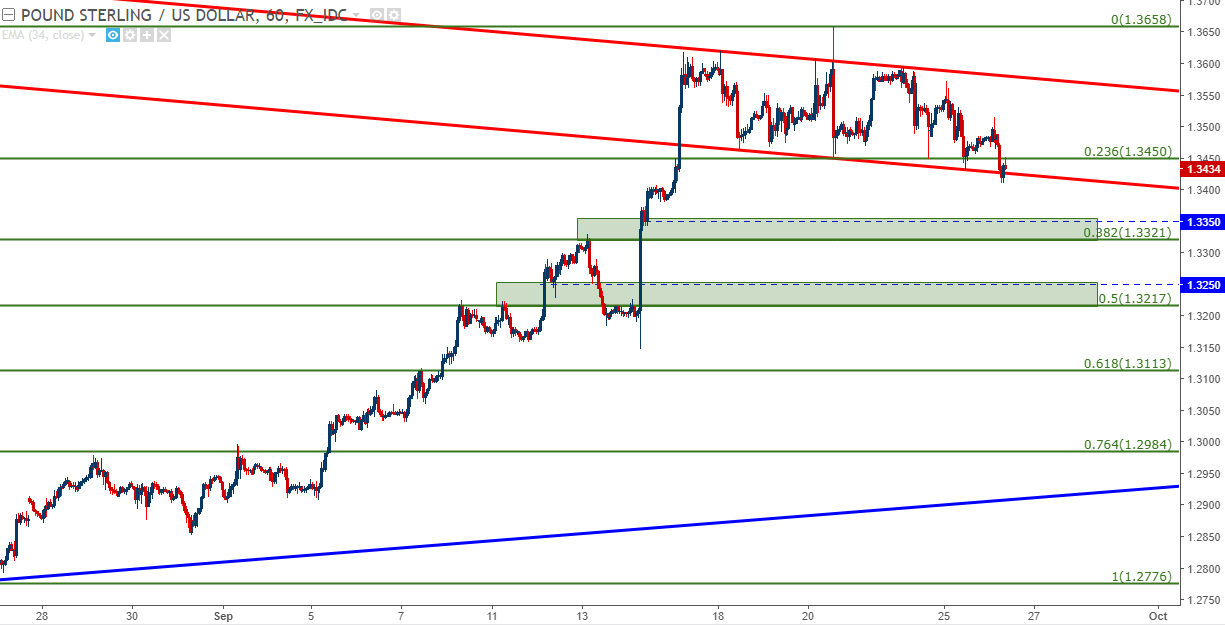
Chart prepared by James Stanley
For stop placement and directional cues, the longer-term, confluent zone that runs from 1.3117-1.3187 could be attractive. If price action is unable to hold above this zone, then the bullish theme in GBP/USD will no longer be attractive, and a break-below can open the door to short-side exposure. But, until that happens, this could be a usable area to look to for stop placement if support shows in either of the above zones.
GBP/USD Daily: Longer-Term Support Zone 1.3117-1.3187 Highlighted

Chart prepared by James Stanley
— Written by James Stanley, Strategist for DailyFX.com
To receive James Stanley’s analysis directly via email, please SIGN UP HERE
Contact and follow James on Twitter: @JStanleyFX


What’s inside:
- EURUSD broke the ‘neckline’ of a bearish ‘head-and-shoulders’ pattern, April trend-line
- Resistance in vicinity of 11825/80 likely to keep a lid on further strength
- Targeting the low to mid-11600s with more selling
Confidence is essential to successful trading, see this new guide – ’Building Confidence in Trading’.
Coming into last week we pointed out the likelihood of finally seeing a resolution of the range EURUSD had been stuck in for the past few weeks, and one of the outcomes we made note of as a possibility was for the triggering of a ’head-and-shoulders’ pattern. Indeed, we saw a break of the ’neckline’ along with a drop below the April trend-line. This led to decent selling before a minor bounce took shape during the latter part of last week.
Looking ahead to next week the euro is set up for further losses as the path of least resistance has turned lower. Looking to a capper on any further strength there is resistance in the 11825-11880 area (old support becomes new resistance). As long as the euro stays below this area a downward bias will remain firmly intact.
Looking lower towards support eyes will be on the August low at 11662 and the 2016 high of 11616, of which the latter just happens to align almost precisely with the measured move target of the ‘head-and-shoulders’ pattern (determined by subtracting the height of the pattern from the neckline).
Bottom line: Shorts look set to have the upperhand as a fresh month gets underway as long as the euro remains capped by resistance. On weakness, we’ll be watching how the euro responds to a drop into support levels.
For a longer-term outlook on EURUSD, check out the just released Q4 Forecast.
EURUSD: Daily

—Written by Paul Robinson, Market Analyst
You can receive Paul’s analysis directly via email bysigning up here.
You can follow Paul on Twitter at@PaulRobinonFX.

Why and how do we use IG Client Sentiment in trading? See our guide and real-time data.
EURUSD: Retail trader data shows 37.3% of traders are net-long with the ratio of traders short to long at 1.68 to 1. In fact, traders have remained net-short since Apr 18 when EURUSD traded near 1.07831; price has moved 9.6% higher since then. The number of traders net-long is 15.4% lower than yesterday and 16.4% higher from last week, while the number of traders net-short is 0.4% higher than yesterday and 10.5% lower from last week.
We typically take a contrarian view to crowd sentiment, and the fact traders are net-short suggests EURUSD prices may continue to rise. Positioning is more net-short than yesterday but less net-short from last week. The combination of current sentiment and recent changes gives us a further mixed EURUSD trading bias.
— Written by Christopher Vecchio, CFA, Senior Currency Strategist
To contact Christopher Vecchio, e-mail cvecchio@dailyfx.com
Follow him on Twitter at @CVecchioFX
To be added to Christopher’s e-mail distribution list, please fill out this form

Why and how do we use IG Client Sentiment in trading? See our guide and real-time data.
GBPUSD: Retail trader data shows 38.2% of traders are net-long with the ratio of traders short to long at 1.62 to 1. In fact, traders have remained net-short since Sep 05 when GBPUSD traded near 1.29615; price has moved 3.4% higher since then. The number of traders net-long is 0.1% higher than yesterday and 13.4% higher from last week, while the number of traders net-short is 10.6% lower than yesterday and 18.3% lower from last week.
We typically take a contrarian view to crowd sentiment, and the fact traders are net-short suggests GBPUSD prices may continue to rise. Yet traders are less net-short than yesterday and compared with last week. Recent changes in sentiment warn that the current GBPUSD price trend may soon reverse lower despite the fact traders remain net-short.
— Written by Christopher Vecchio, CFA, Senior Currency Strategist
To contact Christopher Vecchio, e-mail cvecchio@dailyfx.com
Follow him on Twitter at @CVecchioFX
To be added to Christopher’s e-mail distribution list, please fill out this form
- Oil product price pain is set to rise as the Strait of Hormuz stays closed into summer
- Brent crude up USD 9/bl on the week… ”deal around the corner” narrative fades
- Market Still Betting on Timely Resolution, But Each Day Raises Shortage Risk
- TACO (or Whatever It Was) Sends Oil Lower — Iran Keeps Choking Hormuz
- Oil stress is rising as the supply chains and buffers are drained
-
Analys från DailyFX11 år ago
EUR/USD Flirts with Monthly Close Under 30 Year Trendline
-
Marknadsnyheter6 år ago
BrainCool AB (publ): erhåller bidrag (grant) om 0,9 MSEK från Vinnova för bolagets projekt inom behandling av covid-19 patienter med hög feber
-

 Marknadsnyheter3 år ago
Upptäck de bästa verktygen för att analysera Bitcoin!
-
Analys från DailyFX13 år ago
Japanese Yen Breakout or Fakeout? ZAR/JPY May Provide the Answer
-

 Marknadsnyheter3 år ago
Därför föredrar svenska spelare att spela via mobiltelefonen
-
Analys från DailyFX13 år ago
Price & Time: Key Levels to Watch in the Aftermath of NFP
-
Analys från DailyFX9 år ago
Gold Prices Falter at Resistance: Is the Bullish Run Finished?
-
 Nyheter8 år ago
Teknisk analys med Martin Hallström och Nils Brobacke