
Analys från DailyFX
FTSE Testing Major Threshold, but Yet to See Rejection
What’s inside:
- FTSE testing major source of resistance
- But has yet to show forceful rejection
- Short-term ‘bear-flag’ could help guide
Struggling to gain momentum in your trading? Check out this beginner’s guide – Building Confidence in Trading
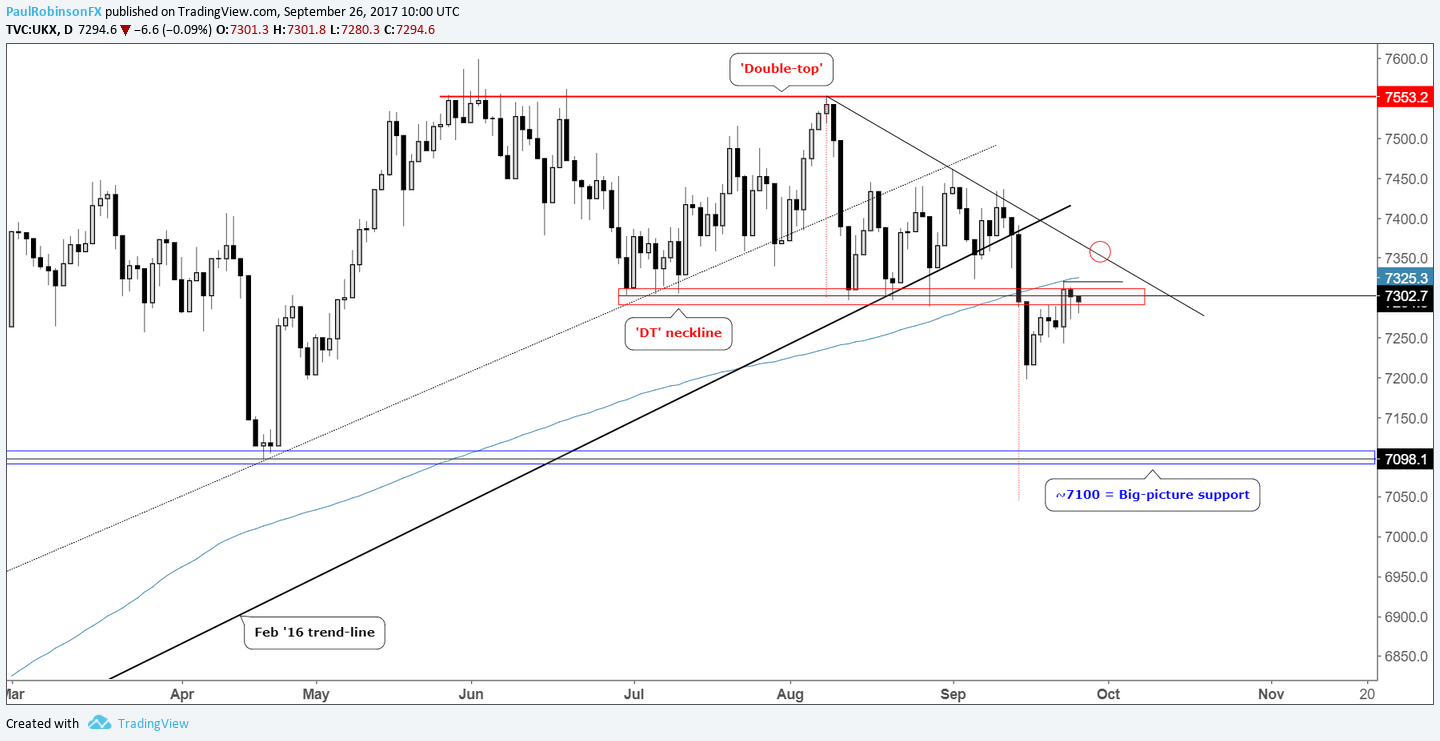
Back on the 15th the FTSE cleanly broke key support surrounding the 7300-level, which was viewed as rather significant given it was not only horizontal support with numerous inflection points but also a confirmation of the double-top formation created between June and August and a drop below the 200-day MA. The break of confluence in support also resulted in a lower-low. The rebound since that break, including the boost received on Theresa May’s ‘Brexit’ speech, has the footsie firmly testing this once critical area of support (old support = new resistance). The high of Friday’s rally was notched almost precisely at the 200-day.
The past couple of sessions the market is struggling to overcome resistance as one would expect, but we aren’t yet seeing the type of rejection which is necessarily indicative of a continuation-move lower set to begin. Ideally, for shorts we want to see a firm rejection of key resistance before becoming aggressive. If we don’t soon see a move lower develop then another attempt to recapture 7300 may soon unfold. If it does, though, the market will still face the rising 200-day once again along with a trend-line off the 8/8 high. A break above the trend-line into the upper-7300s would be a solid recapture of resistance and we would be forced to once again view 7300 as support.
FTSE: Daily
Paul conducts webinars Tuesday-Friday. See the Webinar Calendar for details, and the full line-up of upcoming live events.
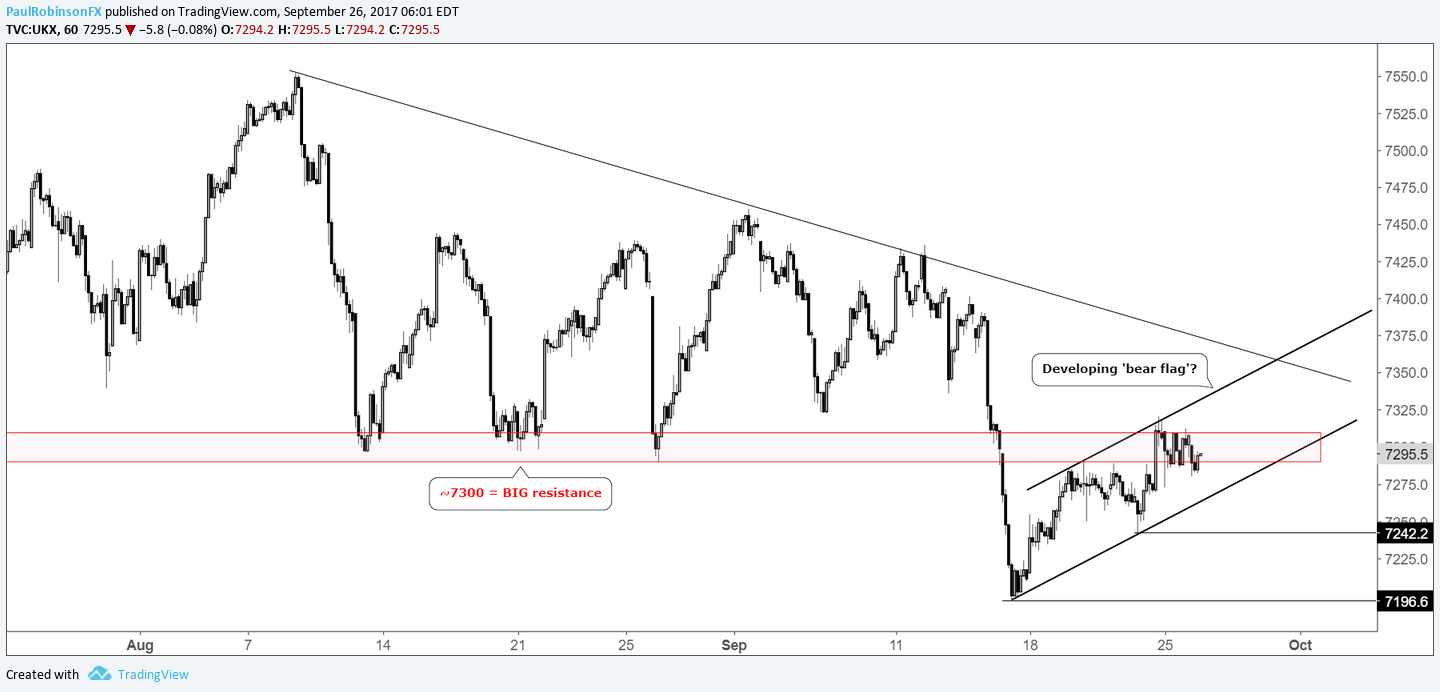
Dialing in closer to the hourly time-frame we can a bullish channel (possible ‘bear-flag’) developing. Even if the FTSE were to continue higher, poking its head above resistance, a break of the lower parallel of a matured ‘bear-flag’ would be our cue to look for a continuation lower. Whether we see a mature pattern develop or not, a break below 7242 would constitute a short-term lower-low and bring the daily swing-low at 7196 into play. From there, trade below that support level would likely bring into play the key long-term level at 7100. The double-top projected target lies lower near 7050, but our respect would be paid to actual price support and not a projected level.
Hourly
Bottom line: Price action has yet to show us that the market wants to turn lower, which may be an indication it will recapture the 7300-threshold, but until it does we will respect its influence as resistance. The short-term time-frame may hold the key for making tactical moves should certain developments take shape.
—Written by Paul Robinson, Market Analyst
You can receive Paul’s analysis directly via email by signing up here.
You can follow Paul on Twitter at @PaulRobinonFX.


What’s inside:
- EURUSD broke the ‘neckline’ of a bearish ‘head-and-shoulders’ pattern, April trend-line
- Resistance in vicinity of 11825/80 likely to keep a lid on further strength
- Targeting the low to mid-11600s with more selling
Confidence is essential to successful trading, see this new guide – ’Building Confidence in Trading’.
Coming into last week we pointed out the likelihood of finally seeing a resolution of the range EURUSD had been stuck in for the past few weeks, and one of the outcomes we made note of as a possibility was for the triggering of a ’head-and-shoulders’ pattern. Indeed, we saw a break of the ’neckline’ along with a drop below the April trend-line. This led to decent selling before a minor bounce took shape during the latter part of last week.
Looking ahead to next week the euro is set up for further losses as the path of least resistance has turned lower. Looking to a capper on any further strength there is resistance in the 11825-11880 area (old support becomes new resistance). As long as the euro stays below this area a downward bias will remain firmly intact.
Looking lower towards support eyes will be on the August low at 11662 and the 2016 high of 11616, of which the latter just happens to align almost precisely with the measured move target of the ‘head-and-shoulders’ pattern (determined by subtracting the height of the pattern from the neckline).
Bottom line: Shorts look set to have the upperhand as a fresh month gets underway as long as the euro remains capped by resistance. On weakness, we’ll be watching how the euro responds to a drop into support levels.
For a longer-term outlook on EURUSD, check out the just released Q4 Forecast.
EURUSD: Daily

—Written by Paul Robinson, Market Analyst
You can receive Paul’s analysis directly via email bysigning up here.
You can follow Paul on Twitter at@PaulRobinonFX.

Why and how do we use IG Client Sentiment in trading? See our guide and real-time data.
EURUSD: Retail trader data shows 37.3% of traders are net-long with the ratio of traders short to long at 1.68 to 1. In fact, traders have remained net-short since Apr 18 when EURUSD traded near 1.07831; price has moved 9.6% higher since then. The number of traders net-long is 15.4% lower than yesterday and 16.4% higher from last week, while the number of traders net-short is 0.4% higher than yesterday and 10.5% lower from last week.
We typically take a contrarian view to crowd sentiment, and the fact traders are net-short suggests EURUSD prices may continue to rise. Positioning is more net-short than yesterday but less net-short from last week. The combination of current sentiment and recent changes gives us a further mixed EURUSD trading bias.
— Written by Christopher Vecchio, CFA, Senior Currency Strategist
To contact Christopher Vecchio, e-mail cvecchio@dailyfx.com
Follow him on Twitter at @CVecchioFX
To be added to Christopher’s e-mail distribution list, please fill out this form

Why and how do we use IG Client Sentiment in trading? See our guide and real-time data.
GBPUSD: Retail trader data shows 38.2% of traders are net-long with the ratio of traders short to long at 1.62 to 1. In fact, traders have remained net-short since Sep 05 when GBPUSD traded near 1.29615; price has moved 3.4% higher since then. The number of traders net-long is 0.1% higher than yesterday and 13.4% higher from last week, while the number of traders net-short is 10.6% lower than yesterday and 18.3% lower from last week.
We typically take a contrarian view to crowd sentiment, and the fact traders are net-short suggests GBPUSD prices may continue to rise. Yet traders are less net-short than yesterday and compared with last week. Recent changes in sentiment warn that the current GBPUSD price trend may soon reverse lower despite the fact traders remain net-short.
— Written by Christopher Vecchio, CFA, Senior Currency Strategist
To contact Christopher Vecchio, e-mail cvecchio@dailyfx.com
Follow him on Twitter at @CVecchioFX
To be added to Christopher’s e-mail distribution list, please fill out this form
- Oil product price pain is set to rise as the Strait of Hormuz stays closed into summer
- Brent crude up USD 9/bl on the week… ”deal around the corner” narrative fades
- Market Still Betting on Timely Resolution, But Each Day Raises Shortage Risk
- TACO (or Whatever It Was) Sends Oil Lower — Iran Keeps Choking Hormuz
- Oil stress is rising as the supply chains and buffers are drained
-
Analys från DailyFX11 år ago
EUR/USD Flirts with Monthly Close Under 30 Year Trendline
-
Marknadsnyheter6 år ago
BrainCool AB (publ): erhåller bidrag (grant) om 0,9 MSEK från Vinnova för bolagets projekt inom behandling av covid-19 patienter med hög feber
-

 Marknadsnyheter3 år ago
Upptäck de bästa verktygen för att analysera Bitcoin!
-
Analys från DailyFX13 år ago
Japanese Yen Breakout or Fakeout? ZAR/JPY May Provide the Answer
-

 Marknadsnyheter3 år ago
Därför föredrar svenska spelare att spela via mobiltelefonen
-
Analys från DailyFX13 år ago
Price & Time: Key Levels to Watch in the Aftermath of NFP
-
Analys från DailyFX9 år ago
Gold Prices Falter at Resistance: Is the Bullish Run Finished?
-
 Nyheter8 år ago
Teknisk analys med Martin Hallström och Nils Brobacke