
Analys från DailyFX
Gold Prices Fall as Global Bond Rout Continues
Talking Points:
– Gold technical strategy: Long-term mixed, Intermediate-term bearish, short-term bearish.
– IG Client Sentiment is currently showing 4.07 traders long for every one short, and given retail sentiment’s contrarian nature, this is bearish.
– If you’re looking for trading ideas, check out our Trading Guides. If you’re looking for shorter-term ideas, check out our IG Client Sentiment.
To receive James Stanley’s Analysis directly via email, please sign up here.
In our last article, we looked at the dramatic open to the week that was seen in Gold prices. After moving up to set a swing-high at $1,258 shortly after the open, the yellow metal caught a series of heavy offers as prices plunged all the way down to $1,236. The move was largely considered to be a ‘fat finger’ error, categorized as an erroneously large trade sold 1.8 million Gold contracts as somewhat of a mistake; but as we pointed out on Monday, this mistake happened right after a very positive German IFO survey was released, showing business sentiment at 47-year highs. That confidence has continued throughout the week as a series of Central Bankers have delivered some relatively hawkish commentary that’s created a rift through global bond markets.
This equates to more selling in Gold. While the U.S. Dollar drives down to fresh 10-month lows, Gold prices have been falling in tandem after setting a lower-high around $1,253, which is around the 4th resistance area that we looked at in that last article. After setting that swing-high, and facing five hours of resistance in that zone yesterday morning, prices had settled at another key area that we’ve been following, which is the 50% Fibonacci retracement at $1,248.98. But that support eventually gave way to the continued selling pressure in Gold with prices breaking-lower, giving the appearance that bearish continuation strategies will continue to be favored.
Gold Hourly Chart Highlighting Continuation of Bearish Price Action
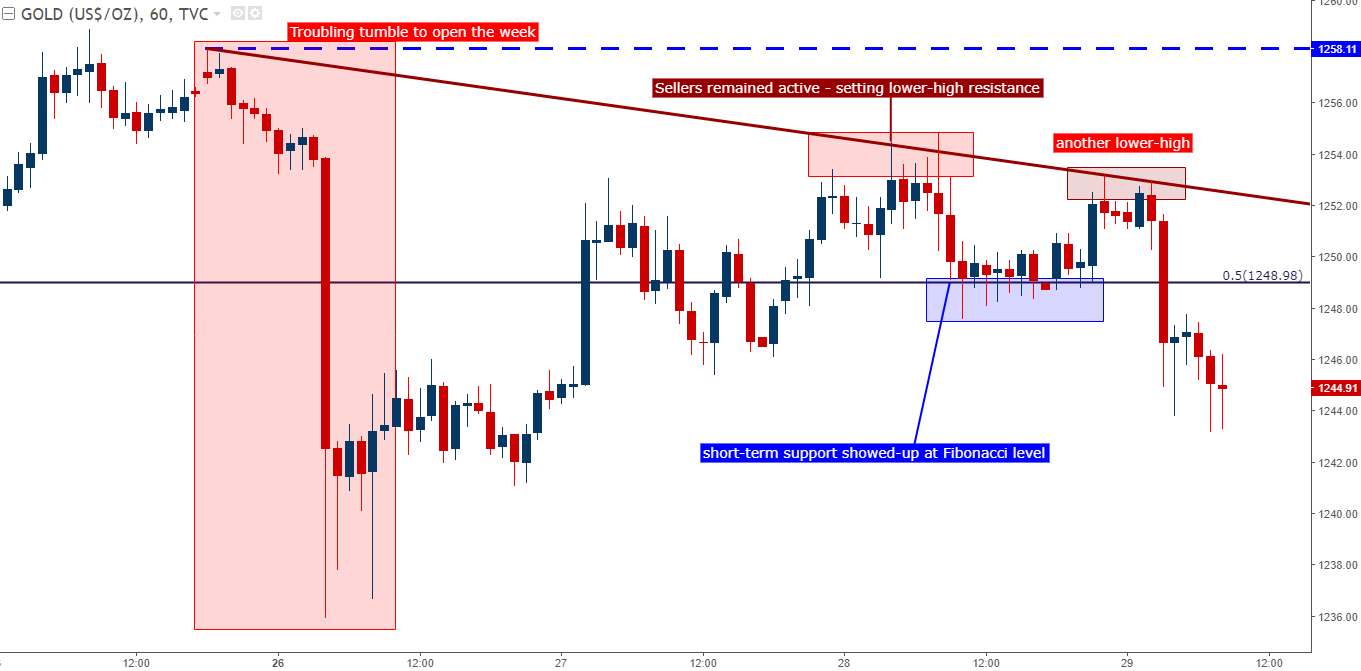
Chart prepared by James Stanley
This Fibonacci level at $1,248.98 is a key price for Gold, as this is the 50% marker of the most recent major move, taking the high from July of 2016 down to the December low. Notably, and perhaps coincidentally, the area around this level had also helped to set the swing-low around the Brexit referendum. But perhaps more importantly, this level has garnered a considerable amount of support and resistance after the move completed last year. Prices remaining below this longer-term level point to the prospect of continued losses in Gold prices.
Gold Daily Chart – Emphasis on 50% Fibonacci retracement of most recent major move
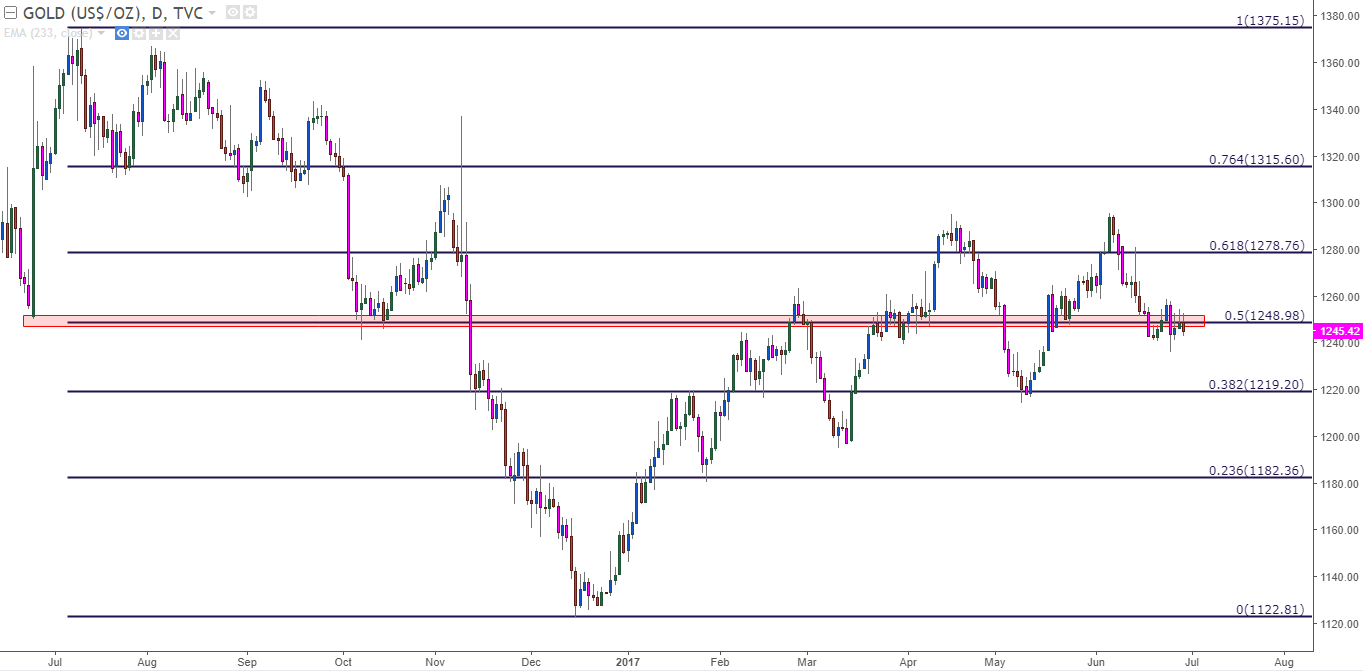
Chart prepared by James Stanley
For re-entry protocol, traders can look to play a continuation of lower-lows and highs, looking to catch ‘lower-high’ resistance below the prior series of swings around $1,254.89. On the chart below, we identify four different resistance levels that can be used to plot a bearish continuation strategy in Gold prices. For those that do not want to wait for resistance, or for those that are comfortable playing momentum-breakouts, the possibility also exists for downside breakout strategies, targeting prior swing-lows at $1,241 and $1,236, respectively.
Gold 30M chart with near-term support and resistance levels identified
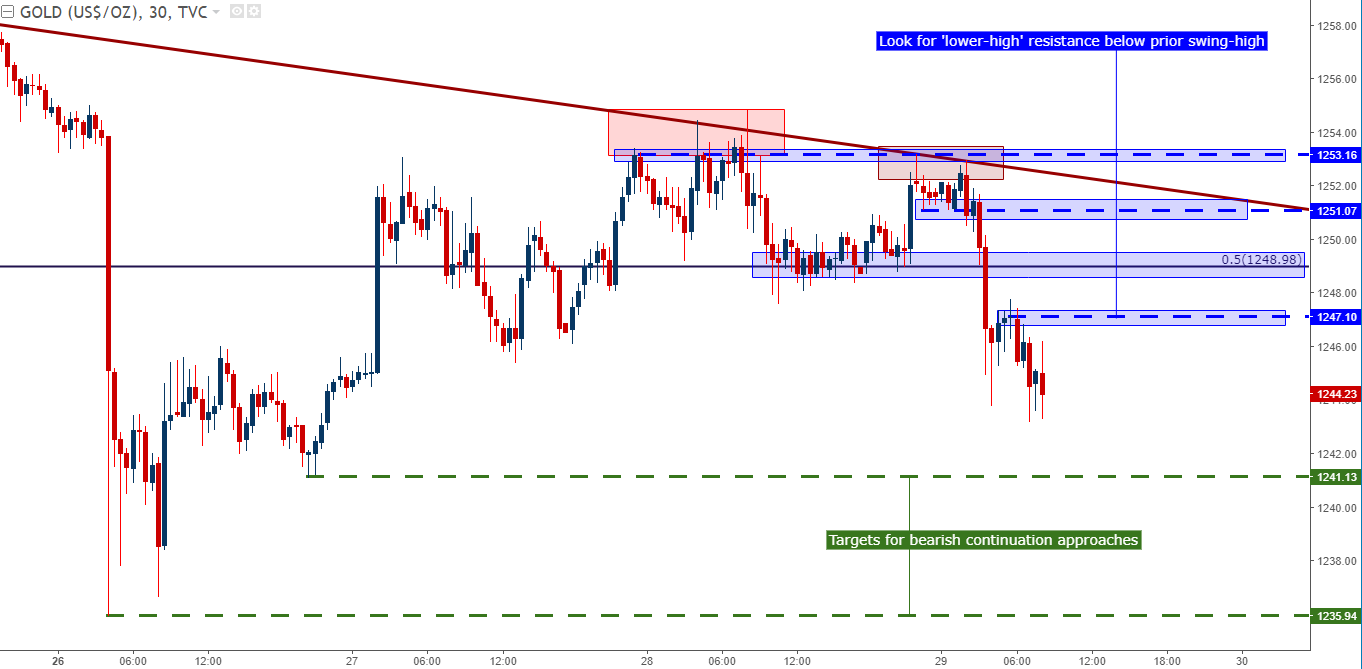
Chart prepared by James Stanley
— Written by James Stanley, Strategist for DailyFX.com
To receive James Stanley’s analysis directly via email, please SIGN UP HERE
Contact and follow James on Twitter: @JStanleyFX


What’s inside:
- EURUSD broke the ‘neckline’ of a bearish ‘head-and-shoulders’ pattern, April trend-line
- Resistance in vicinity of 11825/80 likely to keep a lid on further strength
- Targeting the low to mid-11600s with more selling
Confidence is essential to successful trading, see this new guide – ’Building Confidence in Trading’.
Coming into last week we pointed out the likelihood of finally seeing a resolution of the range EURUSD had been stuck in for the past few weeks, and one of the outcomes we made note of as a possibility was for the triggering of a ’head-and-shoulders’ pattern. Indeed, we saw a break of the ’neckline’ along with a drop below the April trend-line. This led to decent selling before a minor bounce took shape during the latter part of last week.
Looking ahead to next week the euro is set up for further losses as the path of least resistance has turned lower. Looking to a capper on any further strength there is resistance in the 11825-11880 area (old support becomes new resistance). As long as the euro stays below this area a downward bias will remain firmly intact.
Looking lower towards support eyes will be on the August low at 11662 and the 2016 high of 11616, of which the latter just happens to align almost precisely with the measured move target of the ‘head-and-shoulders’ pattern (determined by subtracting the height of the pattern from the neckline).
Bottom line: Shorts look set to have the upperhand as a fresh month gets underway as long as the euro remains capped by resistance. On weakness, we’ll be watching how the euro responds to a drop into support levels.
For a longer-term outlook on EURUSD, check out the just released Q4 Forecast.
EURUSD: Daily

—Written by Paul Robinson, Market Analyst
You can receive Paul’s analysis directly via email bysigning up here.
You can follow Paul on Twitter at@PaulRobinonFX.

Why and how do we use IG Client Sentiment in trading? See our guide and real-time data.
EURUSD: Retail trader data shows 37.3% of traders are net-long with the ratio of traders short to long at 1.68 to 1. In fact, traders have remained net-short since Apr 18 when EURUSD traded near 1.07831; price has moved 9.6% higher since then. The number of traders net-long is 15.4% lower than yesterday and 16.4% higher from last week, while the number of traders net-short is 0.4% higher than yesterday and 10.5% lower from last week.
We typically take a contrarian view to crowd sentiment, and the fact traders are net-short suggests EURUSD prices may continue to rise. Positioning is more net-short than yesterday but less net-short from last week. The combination of current sentiment and recent changes gives us a further mixed EURUSD trading bias.
— Written by Christopher Vecchio, CFA, Senior Currency Strategist
To contact Christopher Vecchio, e-mail cvecchio@dailyfx.com
Follow him on Twitter at @CVecchioFX
To be added to Christopher’s e-mail distribution list, please fill out this form

Why and how do we use IG Client Sentiment in trading? See our guide and real-time data.
GBPUSD: Retail trader data shows 38.2% of traders are net-long with the ratio of traders short to long at 1.62 to 1. In fact, traders have remained net-short since Sep 05 when GBPUSD traded near 1.29615; price has moved 3.4% higher since then. The number of traders net-long is 0.1% higher than yesterday and 13.4% higher from last week, while the number of traders net-short is 10.6% lower than yesterday and 18.3% lower from last week.
We typically take a contrarian view to crowd sentiment, and the fact traders are net-short suggests GBPUSD prices may continue to rise. Yet traders are less net-short than yesterday and compared with last week. Recent changes in sentiment warn that the current GBPUSD price trend may soon reverse lower despite the fact traders remain net-short.
— Written by Christopher Vecchio, CFA, Senior Currency Strategist
To contact Christopher Vecchio, e-mail cvecchio@dailyfx.com
Follow him on Twitter at @CVecchioFX
To be added to Christopher’s e-mail distribution list, please fill out this form
-
Analys från DailyFX10 år ago
EUR/USD Flirts with Monthly Close Under 30 Year Trendline
-
Marknadsnyheter5 år ago
BrainCool AB (publ): erhåller bidrag (grant) om 0,9 MSEK från Vinnova för bolagets projekt inom behandling av covid-19 patienter med hög feber
-

 Marknadsnyheter3 år ago
Upptäck de bästa verktygen för att analysera Bitcoin!
-
Analys från DailyFX12 år ago
Japanese Yen Breakout or Fakeout? ZAR/JPY May Provide the Answer
-

 Marknadsnyheter2 år ago
Därför föredrar svenska spelare att spela via mobiltelefonen
-
Analys från DailyFX12 år ago
Price & Time: Key Levels to Watch in the Aftermath of NFP
-
Analys från DailyFX8 år ago
Gold Prices Falter at Resistance: Is the Bullish Run Finished?
-
 Nyheter7 år ago
Teknisk analys med Martin Hallström och Nils Brobacke