
Analys från DailyFX
Gold Prices Run Through $1,300 as Dollar Weakness, Risk Aversion Flares
To receive James Stanley’s Analysis directly via email, please sign up here.
Talking Points:
– Gold prices staged an aggressive bullish breakout beyond the $1,300 psychological level.
– IG Client Sentiment is currently showing a read of +1.705 for Gold.
– Want to see how Gold prices have held up to our DailyFX forecasts? Click here for full access.
In our last article, we looked at Gold prices after a failed breakout at the psychological level of $1,300. This failed breakout took place after another key resistance level had yielded at $1,296, as a double top had formed after the April and June advances turned-around at this price. But the third approach in August saw prices run through $1,296, setting a fresh short-term high at $1,300 before sellers were able to take-over as we walked into the Jackson Hole Economic Symposium.
That short-term bearish tonality lasted in Gold for most of last week, with prices even posing a down-side breech on Friday just ahead of Chair Yellen and ECB President Mario Draghi’s speeches in Wyoming. But as Chair Yellen began speaking, the Dollar started to drop again, and this firmed-up Gold prices as we moved into last week’s close. The following Monday morning, shortly after the open of the U.S. session, Gold prices broke through $1,300 and didn’t pause until we set a fresh nine-month high around the $1,325-handle. We’re looking at this recent move on the below chart, while also pointing out what could be an interesting level to work with around $1,308.
Gold Prices Breakout to Fresh Nine-Month Highs After Jackson Hole
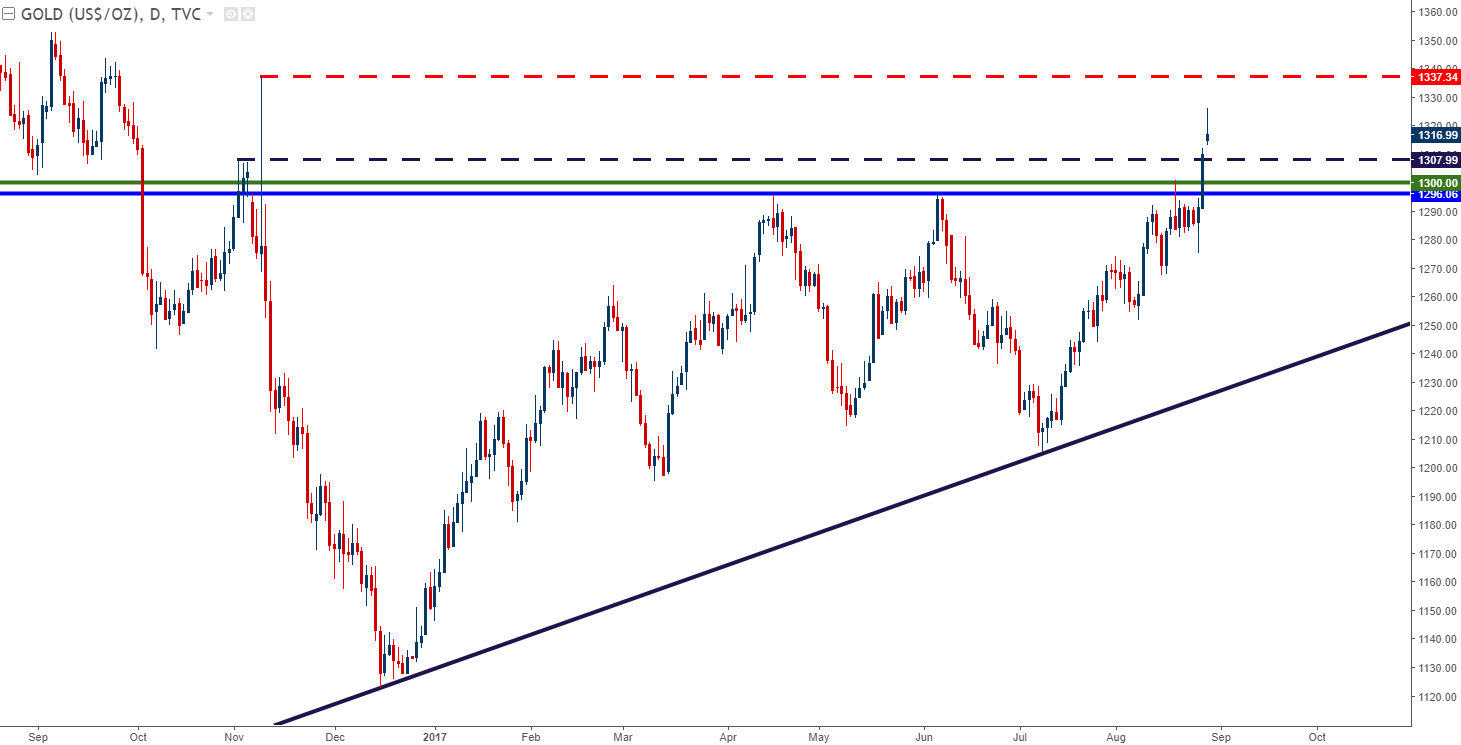
Chart prepared by James Stanley
The most recent driver to provide fuel for Gold prices was last night’s missile launch out of North Korea. This time, North Korea’s missile traveled over Japan, raising worries of an actual attack. This brought a brief run of risk aversion to global markets, which has begun to recede as we’ve moved deeper into the U.S. session. This is likely why we’ve seen a chunk of that recent top-side breakout erased as a retracement has begun to show. This highlights the danger of trying to chase Gold prices at the moment: Volatility is likely going to continue to show on both sides as these very pressing themes of Dollar weakness and global risk aversion continue to develop.
For traders looking at taking on long exposure in Gold, they’d likely want to wait for some element of support to show before triggering the position. Given the response on Friday, the prior swing-low in Gold is all the way down to $1,274.45, which, as of this writing, would be more than $42 in risk. That would necessitate a move to $1,359 to justify a one-to-one risk-reward ratio, which would require breaking through multiple resistance levels on the way-up. Instead, an inside move to a deeper support level can open the door for bullish continuation strategies. The level we mentioned about around $1,308 could be interesting, as this was the pre-Election swing-high in Gold prices. Below that, we have the prior breakout zone that runs from $1,296-$1,300 that could be usable for secondary support. Each of these could afford a more efficient entry with stops below that prior swing.

Chart prepared by James Stanley
If Gold prices don’t retrace and if this bullish move continues without much additional pullback, there are a series of potential resistance levels resting above current price action. These can be targets for bullish positions, or for those looking to set up an entry, each of these resistance levels can be used to look for a pause in the bullish advance, at which point the traders can attempt to buy support at prior resistance (the previous level).
Gold Daily: Plethora of Potential Resistance Levels Above Current Price (2016’s Bearish Grind)
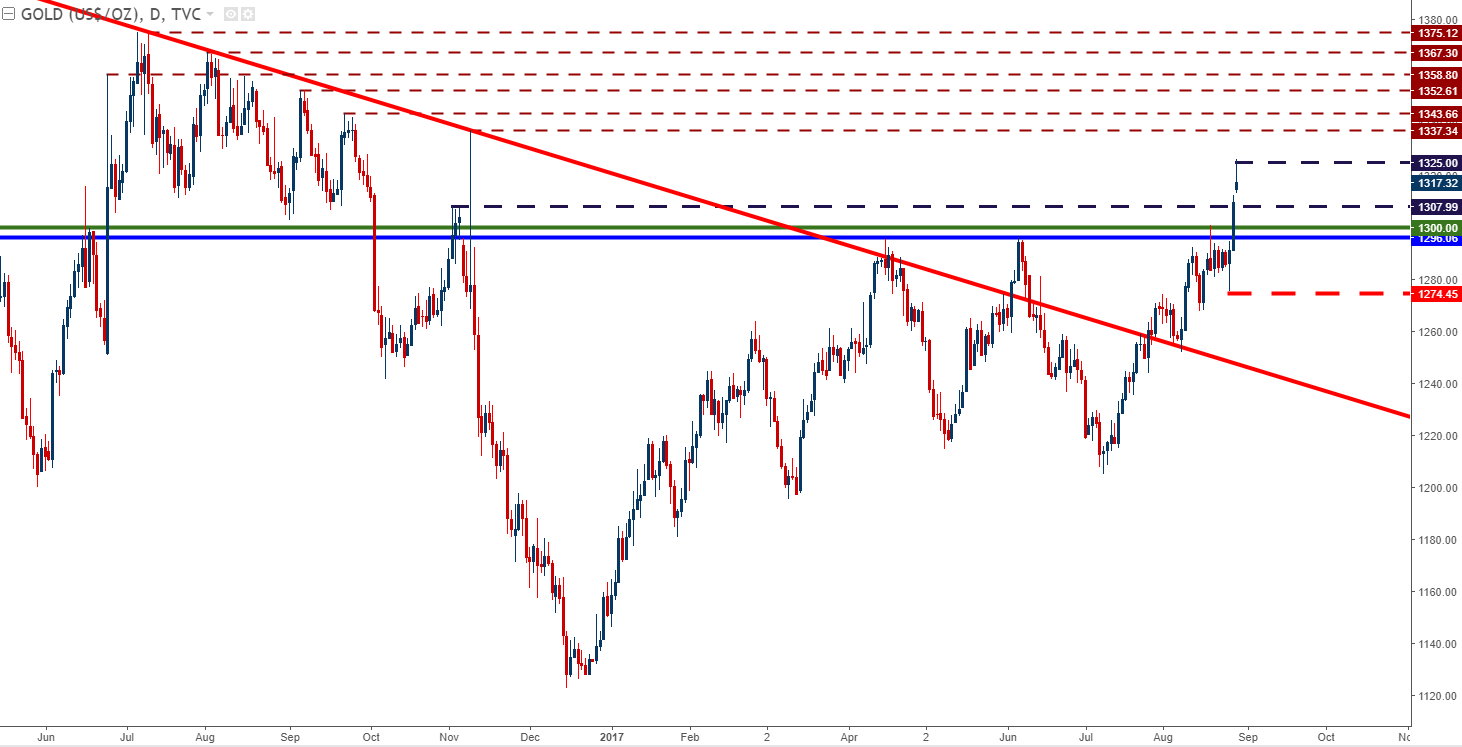
Chart prepared by James Stanley
— Written by James Stanley, Strategist for DailyFX.com
To receive James Stanley’s analysis directly via email, please SIGN UP HERE
Contact and follow James on Twitter: @JStanleyFX


What’s inside:
- EURUSD broke the ‘neckline’ of a bearish ‘head-and-shoulders’ pattern, April trend-line
- Resistance in vicinity of 11825/80 likely to keep a lid on further strength
- Targeting the low to mid-11600s with more selling
Confidence is essential to successful trading, see this new guide – ’Building Confidence in Trading’.
Coming into last week we pointed out the likelihood of finally seeing a resolution of the range EURUSD had been stuck in for the past few weeks, and one of the outcomes we made note of as a possibility was for the triggering of a ’head-and-shoulders’ pattern. Indeed, we saw a break of the ’neckline’ along with a drop below the April trend-line. This led to decent selling before a minor bounce took shape during the latter part of last week.
Looking ahead to next week the euro is set up for further losses as the path of least resistance has turned lower. Looking to a capper on any further strength there is resistance in the 11825-11880 area (old support becomes new resistance). As long as the euro stays below this area a downward bias will remain firmly intact.
Looking lower towards support eyes will be on the August low at 11662 and the 2016 high of 11616, of which the latter just happens to align almost precisely with the measured move target of the ‘head-and-shoulders’ pattern (determined by subtracting the height of the pattern from the neckline).
Bottom line: Shorts look set to have the upperhand as a fresh month gets underway as long as the euro remains capped by resistance. On weakness, we’ll be watching how the euro responds to a drop into support levels.
For a longer-term outlook on EURUSD, check out the just released Q4 Forecast.
EURUSD: Daily

—Written by Paul Robinson, Market Analyst
You can receive Paul’s analysis directly via email bysigning up here.
You can follow Paul on Twitter at@PaulRobinonFX.

Why and how do we use IG Client Sentiment in trading? See our guide and real-time data.
EURUSD: Retail trader data shows 37.3% of traders are net-long with the ratio of traders short to long at 1.68 to 1. In fact, traders have remained net-short since Apr 18 when EURUSD traded near 1.07831; price has moved 9.6% higher since then. The number of traders net-long is 15.4% lower than yesterday and 16.4% higher from last week, while the number of traders net-short is 0.4% higher than yesterday and 10.5% lower from last week.
We typically take a contrarian view to crowd sentiment, and the fact traders are net-short suggests EURUSD prices may continue to rise. Positioning is more net-short than yesterday but less net-short from last week. The combination of current sentiment and recent changes gives us a further mixed EURUSD trading bias.
— Written by Christopher Vecchio, CFA, Senior Currency Strategist
To contact Christopher Vecchio, e-mail cvecchio@dailyfx.com
Follow him on Twitter at @CVecchioFX
To be added to Christopher’s e-mail distribution list, please fill out this form

Why and how do we use IG Client Sentiment in trading? See our guide and real-time data.
GBPUSD: Retail trader data shows 38.2% of traders are net-long with the ratio of traders short to long at 1.62 to 1. In fact, traders have remained net-short since Sep 05 when GBPUSD traded near 1.29615; price has moved 3.4% higher since then. The number of traders net-long is 0.1% higher than yesterday and 13.4% higher from last week, while the number of traders net-short is 10.6% lower than yesterday and 18.3% lower from last week.
We typically take a contrarian view to crowd sentiment, and the fact traders are net-short suggests GBPUSD prices may continue to rise. Yet traders are less net-short than yesterday and compared with last week. Recent changes in sentiment warn that the current GBPUSD price trend may soon reverse lower despite the fact traders remain net-short.
— Written by Christopher Vecchio, CFA, Senior Currency Strategist
To contact Christopher Vecchio, e-mail cvecchio@dailyfx.com
Follow him on Twitter at @CVecchioFX
To be added to Christopher’s e-mail distribution list, please fill out this form
- Oil product price pain is set to rise as the Strait of Hormuz stays closed into summer
- Brent crude up USD 9/bl on the week… ”deal around the corner” narrative fades
- Market Still Betting on Timely Resolution, But Each Day Raises Shortage Risk
- TACO (or Whatever It Was) Sends Oil Lower — Iran Keeps Choking Hormuz
- Oil stress is rising as the supply chains and buffers are drained
-
Analys från DailyFX11 år ago
EUR/USD Flirts with Monthly Close Under 30 Year Trendline
-
Marknadsnyheter6 år ago
BrainCool AB (publ): erhåller bidrag (grant) om 0,9 MSEK från Vinnova för bolagets projekt inom behandling av covid-19 patienter med hög feber
-

 Marknadsnyheter3 år ago
Upptäck de bästa verktygen för att analysera Bitcoin!
-
Analys från DailyFX13 år ago
Japanese Yen Breakout or Fakeout? ZAR/JPY May Provide the Answer
-

 Marknadsnyheter3 år ago
Därför föredrar svenska spelare att spela via mobiltelefonen
-
Analys från DailyFX13 år ago
Price & Time: Key Levels to Watch in the Aftermath of NFP
-
Analys från DailyFX9 år ago
Gold Prices Falter at Resistance: Is the Bullish Run Finished?
-
 Nyheter8 år ago
Teknisk analys med Martin Hallström och Nils Brobacke