
Analys från DailyFX
Technical Analysis: ASX 200 Set to Break Chart Deadlock
Talking Points:
- The Australian benchmark has been stuck between a broken uptrend and quite strong support
- Now it looks as though something has to change
- The next couple of days could be well worth watching
Make sure your ASX trading strategy is up to the mark with thisDailyFX guide
A week may be a long time in some markets but the last seven days haven’t changed much in terms of the ASX 200’s technical picture.
My last look, a week back, found the index worryingly below an uptrend channel which had thereto lasted for all of 2017. Support at the lows of February 28 March 23 was containing losses.
A week later the index remains below that uptrend channel but those supports are holding. Indeed, it can hardly be coincidental that the clearest recent low (May 18’s intraday bottom) was also February 28’snadir of 5679.90.

However, as you can see from the chart above, price action since that bounce has been inconclusive at best. The bulls have shown no appetite to regain the 5834 level which came before the precipitous fall seen on May 17. But, by the same token, bears have yet to retest that now-critical support level we talked about earlier.
It looks as though something is about to give though. The index is currently flirting oh-so-closely with the top of a downtrend line which has been in place since it topped out back in early May.
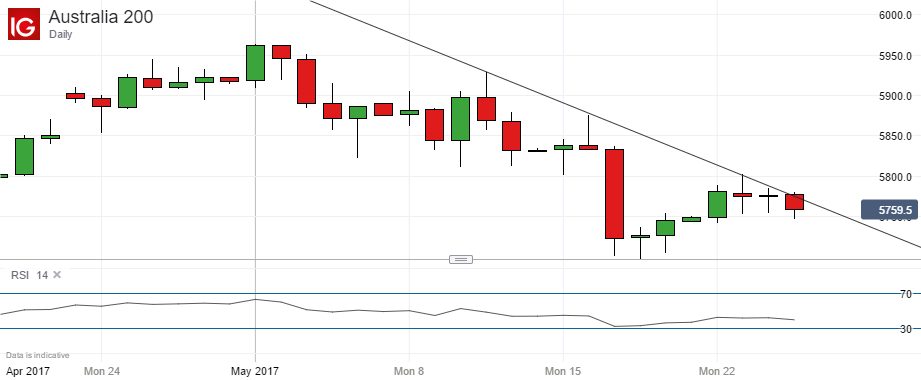
If it can close above this level, currently 5778.70, then the bulls might start to feel a little bolder. If it can’t, then the downtrend strongly suggests another try at that 5679.90 prop and the lows for this year which lurk beneath.
One modest bit of support for the bullish view might come from the index’s Relative Strength Index (RSI). This isn’t flashing any warning signs yet, up or down, but it is meandering down towards territory at which many analysts would think the market was oversold.
The next couple of days’ closing levels should be very interesting indeed.
— Written by David Cottle, DailyFX Research
Contact and follow David on Twitter:@DavidCottleFX


What’s inside:
- EURUSD broke the ‘neckline’ of a bearish ‘head-and-shoulders’ pattern, April trend-line
- Resistance in vicinity of 11825/80 likely to keep a lid on further strength
- Targeting the low to mid-11600s with more selling
Confidence is essential to successful trading, see this new guide – ’Building Confidence in Trading’.
Coming into last week we pointed out the likelihood of finally seeing a resolution of the range EURUSD had been stuck in for the past few weeks, and one of the outcomes we made note of as a possibility was for the triggering of a ’head-and-shoulders’ pattern. Indeed, we saw a break of the ’neckline’ along with a drop below the April trend-line. This led to decent selling before a minor bounce took shape during the latter part of last week.
Looking ahead to next week the euro is set up for further losses as the path of least resistance has turned lower. Looking to a capper on any further strength there is resistance in the 11825-11880 area (old support becomes new resistance). As long as the euro stays below this area a downward bias will remain firmly intact.
Looking lower towards support eyes will be on the August low at 11662 and the 2016 high of 11616, of which the latter just happens to align almost precisely with the measured move target of the ‘head-and-shoulders’ pattern (determined by subtracting the height of the pattern from the neckline).
Bottom line: Shorts look set to have the upperhand as a fresh month gets underway as long as the euro remains capped by resistance. On weakness, we’ll be watching how the euro responds to a drop into support levels.
For a longer-term outlook on EURUSD, check out the just released Q4 Forecast.
EURUSD: Daily

—Written by Paul Robinson, Market Analyst
You can receive Paul’s analysis directly via email bysigning up here.
You can follow Paul on Twitter at@PaulRobinonFX.

Why and how do we use IG Client Sentiment in trading? See our guide and real-time data.
EURUSD: Retail trader data shows 37.3% of traders are net-long with the ratio of traders short to long at 1.68 to 1. In fact, traders have remained net-short since Apr 18 when EURUSD traded near 1.07831; price has moved 9.6% higher since then. The number of traders net-long is 15.4% lower than yesterday and 16.4% higher from last week, while the number of traders net-short is 0.4% higher than yesterday and 10.5% lower from last week.
We typically take a contrarian view to crowd sentiment, and the fact traders are net-short suggests EURUSD prices may continue to rise. Positioning is more net-short than yesterday but less net-short from last week. The combination of current sentiment and recent changes gives us a further mixed EURUSD trading bias.
— Written by Christopher Vecchio, CFA, Senior Currency Strategist
To contact Christopher Vecchio, e-mail cvecchio@dailyfx.com
Follow him on Twitter at @CVecchioFX
To be added to Christopher’s e-mail distribution list, please fill out this form

Why and how do we use IG Client Sentiment in trading? See our guide and real-time data.
GBPUSD: Retail trader data shows 38.2% of traders are net-long with the ratio of traders short to long at 1.62 to 1. In fact, traders have remained net-short since Sep 05 when GBPUSD traded near 1.29615; price has moved 3.4% higher since then. The number of traders net-long is 0.1% higher than yesterday and 13.4% higher from last week, while the number of traders net-short is 10.6% lower than yesterday and 18.3% lower from last week.
We typically take a contrarian view to crowd sentiment, and the fact traders are net-short suggests GBPUSD prices may continue to rise. Yet traders are less net-short than yesterday and compared with last week. Recent changes in sentiment warn that the current GBPUSD price trend may soon reverse lower despite the fact traders remain net-short.
— Written by Christopher Vecchio, CFA, Senior Currency Strategist
To contact Christopher Vecchio, e-mail cvecchio@dailyfx.com
Follow him on Twitter at @CVecchioFX
To be added to Christopher’s e-mail distribution list, please fill out this form
- Whipping quota cheaters into line is still the most likely explanation
- June OPEC+ quota: Another triple increase or sticking to plan with +137 kb/d increase?
- Unusual strong bearish market conviction but OPEC+ market strategy is always a wildcard
- Oil demand at risk as US consumers soon will face hard tariff-realities
- Brent crude is now trading below its nominal 2018-19 average in EUR/barrel terms
-
Analys från DailyFX9 år ago
EUR/USD Flirts with Monthly Close Under 30 Year Trendline
-

 Marknadsnyheter2 år ago
Upptäck de bästa verktygen för att analysera Bitcoin!
-
Marknadsnyheter5 år ago
BrainCool AB (publ): erhåller bidrag (grant) om 0,9 MSEK från Vinnova för bolagets projekt inom behandling av covid-19 patienter med hög feber
-
Analys från DailyFX12 år ago
Japanese Yen Breakout or Fakeout? ZAR/JPY May Provide the Answer
-

 Marknadsnyheter2 år ago
Därför föredrar svenska spelare att spela via mobiltelefonen
-
Analys från DailyFX12 år ago
Price & Time: Key Levels to Watch in the Aftermath of NFP
-
Analys från DailyFX8 år ago
Gold Prices Falter at Resistance: Is the Bullish Run Finished?
-
 Nyheter6 år ago
Teknisk analys med Martin Hallström och Nils Brobacke