
Analys från DailyFX
Technical Analysis: Nikkei 225 Breakdown Doesn’t Mean Danger Yet
Talking Points
- A broken downtrend need not be awful news for the Nikkei 225
- It could simply be consolidating at an encouragingly high level
- However, watch the monthly chart. It may have a more worrying tale for us
Get live coverage of all the key Asia/Pacific economic data with the DailyFX webinars
In technical analysis, as in life, a sense of perspective can be crucial.
To be sure, looked at from one rather obvious perspective, the Nikkei 225 is in trouble. For on June 7 the index clearly broke away to the downside from an uptrend channel which had sustained its impressive gains since April 17. What’s more that was the second downsidw break in short order. And, unlike in its first loss of footing at the end of May, the index did not swiftly regain its composure. It remains below that channel. Indeed the downside break now looks quite conclusive, having endured for six sessions.
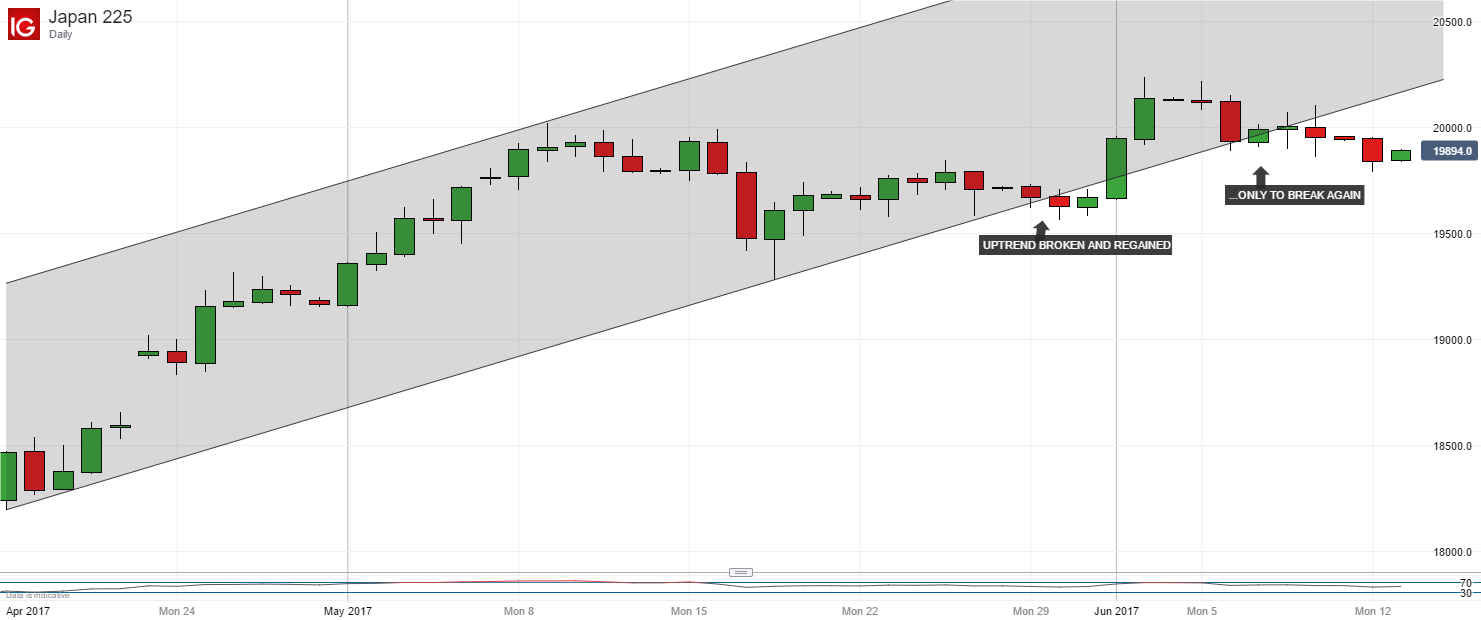
But this is where some perspective seems warranted. For, despite abandoning that uptrend, the index has hardly suffered any catastrophic fall. Indeed, it remains close to its peak for the year, which is also its highest point since late 2015. Channel break or not, many investors are still happy to hold on.
And, if we change our perspective and look at the action since the start of 2017, what we see is an index consolidating its climb from April’s lows quite convcingly. It’s also settling into range trading at a much higher level than that which has pertained for much of the year. That range doesn’t look obviously threatened either. The Relative Strength Index (RSI) is in “relaxed” territory, well below the 70 level which might set the alarm bells of overbuying to chime. Should bulls be cheered?
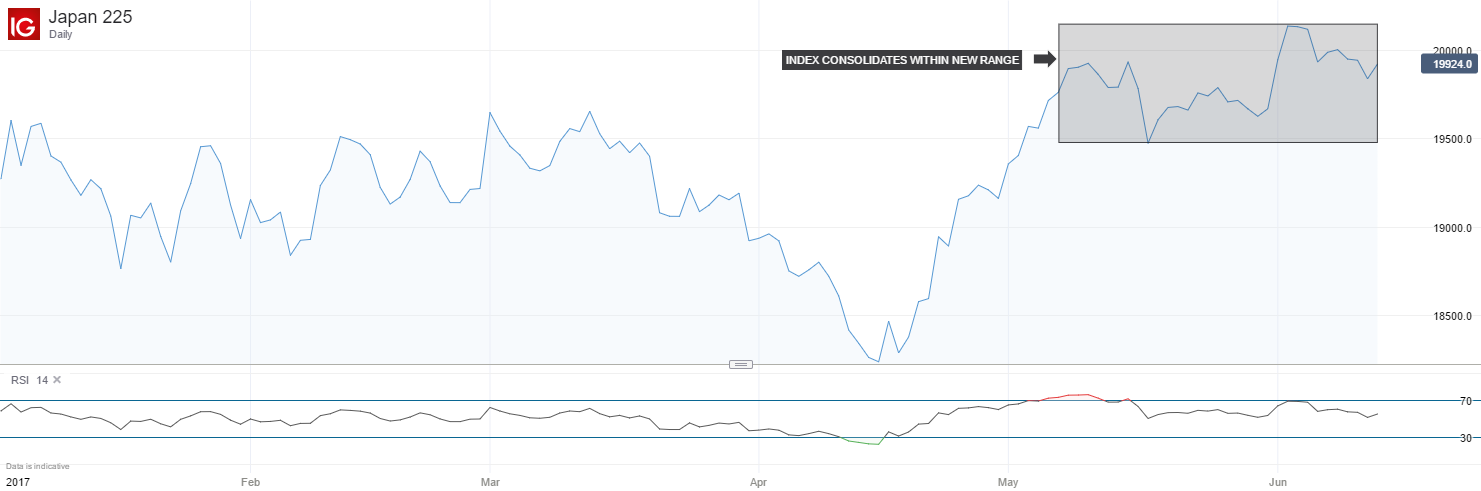
Well, perhaps. But clearly none of the above means that the index is absolutely safe from a sharper downturn, nor that the uptrend channel break we talked of earlier is inisgnificant. But clear signs of consolidation so close to important highs are at least encouraging.
However, I think it’s perinent to end with a word of warning, even if it requires us to flip perspective yet again. On its monthly candlestick chart the Nikkei looks very much like an index which is developing a double-top formation. This is usually a bearish signal and it happens when an index peaks, then forms a shallow trough only to peak again – for the last time before retracing.
A look at this chart shows that first peak in place, then that shallow trough. Another assault on the peak is in play.
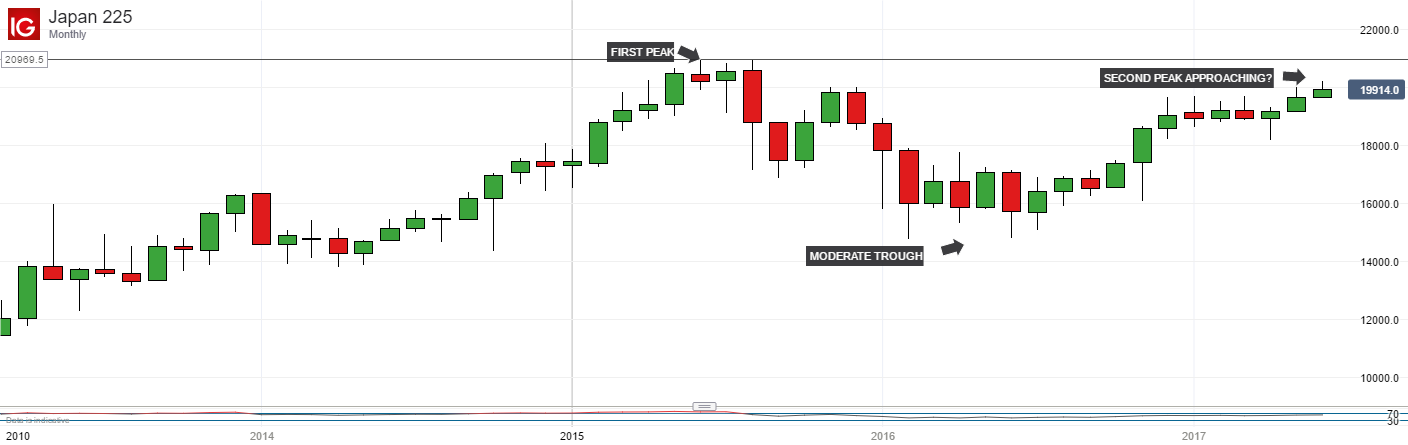
This will bear watching, even if on shorter term charts the Nikkei still apears to be merely consolidating. Something more sinister could be up.
— Written by David Cottle, DailyFX Research
Contact and follow David on Twitter: @DavidCottleFX


What’s inside:
- EURUSD broke the ‘neckline’ of a bearish ‘head-and-shoulders’ pattern, April trend-line
- Resistance in vicinity of 11825/80 likely to keep a lid on further strength
- Targeting the low to mid-11600s with more selling
Confidence is essential to successful trading, see this new guide – ’Building Confidence in Trading’.
Coming into last week we pointed out the likelihood of finally seeing a resolution of the range EURUSD had been stuck in for the past few weeks, and one of the outcomes we made note of as a possibility was for the triggering of a ’head-and-shoulders’ pattern. Indeed, we saw a break of the ’neckline’ along with a drop below the April trend-line. This led to decent selling before a minor bounce took shape during the latter part of last week.
Looking ahead to next week the euro is set up for further losses as the path of least resistance has turned lower. Looking to a capper on any further strength there is resistance in the 11825-11880 area (old support becomes new resistance). As long as the euro stays below this area a downward bias will remain firmly intact.
Looking lower towards support eyes will be on the August low at 11662 and the 2016 high of 11616, of which the latter just happens to align almost precisely with the measured move target of the ‘head-and-shoulders’ pattern (determined by subtracting the height of the pattern from the neckline).
Bottom line: Shorts look set to have the upperhand as a fresh month gets underway as long as the euro remains capped by resistance. On weakness, we’ll be watching how the euro responds to a drop into support levels.
For a longer-term outlook on EURUSD, check out the just released Q4 Forecast.
EURUSD: Daily

—Written by Paul Robinson, Market Analyst
You can receive Paul’s analysis directly via email bysigning up here.
You can follow Paul on Twitter at@PaulRobinonFX.

Why and how do we use IG Client Sentiment in trading? See our guide and real-time data.
EURUSD: Retail trader data shows 37.3% of traders are net-long with the ratio of traders short to long at 1.68 to 1. In fact, traders have remained net-short since Apr 18 when EURUSD traded near 1.07831; price has moved 9.6% higher since then. The number of traders net-long is 15.4% lower than yesterday and 16.4% higher from last week, while the number of traders net-short is 0.4% higher than yesterday and 10.5% lower from last week.
We typically take a contrarian view to crowd sentiment, and the fact traders are net-short suggests EURUSD prices may continue to rise. Positioning is more net-short than yesterday but less net-short from last week. The combination of current sentiment and recent changes gives us a further mixed EURUSD trading bias.
— Written by Christopher Vecchio, CFA, Senior Currency Strategist
To contact Christopher Vecchio, e-mail cvecchio@dailyfx.com
Follow him on Twitter at @CVecchioFX
To be added to Christopher’s e-mail distribution list, please fill out this form

Why and how do we use IG Client Sentiment in trading? See our guide and real-time data.
GBPUSD: Retail trader data shows 38.2% of traders are net-long with the ratio of traders short to long at 1.62 to 1. In fact, traders have remained net-short since Sep 05 when GBPUSD traded near 1.29615; price has moved 3.4% higher since then. The number of traders net-long is 0.1% higher than yesterday and 13.4% higher from last week, while the number of traders net-short is 10.6% lower than yesterday and 18.3% lower from last week.
We typically take a contrarian view to crowd sentiment, and the fact traders are net-short suggests GBPUSD prices may continue to rise. Yet traders are less net-short than yesterday and compared with last week. Recent changes in sentiment warn that the current GBPUSD price trend may soon reverse lower despite the fact traders remain net-short.
— Written by Christopher Vecchio, CFA, Senior Currency Strategist
To contact Christopher Vecchio, e-mail cvecchio@dailyfx.com
Follow him on Twitter at @CVecchioFX
To be added to Christopher’s e-mail distribution list, please fill out this form
- Oil product price pain is set to rise as the Strait of Hormuz stays closed into summer
- Brent crude up USD 9/bl on the week… ”deal around the corner” narrative fades
- Market Still Betting on Timely Resolution, But Each Day Raises Shortage Risk
- TACO (or Whatever It Was) Sends Oil Lower — Iran Keeps Choking Hormuz
- Oil stress is rising as the supply chains and buffers are drained
-
Analys från DailyFX11 år ago
EUR/USD Flirts with Monthly Close Under 30 Year Trendline
-
Marknadsnyheter6 år ago
BrainCool AB (publ): erhåller bidrag (grant) om 0,9 MSEK från Vinnova för bolagets projekt inom behandling av covid-19 patienter med hög feber
-

 Marknadsnyheter3 år ago
Upptäck de bästa verktygen för att analysera Bitcoin!
-
Analys från DailyFX13 år ago
Japanese Yen Breakout or Fakeout? ZAR/JPY May Provide the Answer
-

 Marknadsnyheter3 år ago
Därför föredrar svenska spelare att spela via mobiltelefonen
-
Analys från DailyFX13 år ago
Price & Time: Key Levels to Watch in the Aftermath of NFP
-
Analys från DailyFX9 år ago
Gold Prices Falter at Resistance: Is the Bullish Run Finished?
-
 Nyheter8 år ago
Teknisk analys med Martin Hallström och Nils Brobacke