
Analys från DailyFX
USD/CAD Price Analysis: BoC Hike Part Deux in Play on GDP Beat
What will happen to the USD as other central banks begin normalization? Click here to see our latest forecasts and find out what trades are developing in this new environment!
Talking Points:
- USD/CAD technical strategy: USD/CAD halts near 61.8% retracement, looking lower
- Strong GDP encourages markets to watch for September BoC Hike
- IGCS Highlight: USD/CAD 34% decrease in weekly short exposure favors contrarian downside bias
The Canadian Dollar experienced a significant bout of strength on Thursday morning after a GDP print for 2Q got people talking. What they were talking about was that another BoC hike could come as soon as the September meeting after a 3.7% expected GDP print came in at 4.5%. This pace of growth in the Canadian Economy is the fastest since 2011.
Another component worth watching that had a +0.98 20-day rolling correlation coefficient, which signals the strength of the relationship, is a tightening between US and CA 2-year yields. You do not have to be well versed in fixed income/ sovereign bonds to see that the two-year yield on a country’s sovereign debt is often treated as a proxy for what the central bankers are expected to do from a monetary policy standpoint. Since May, we have seen the spread between US and CA 2-year yields go from 61 bps in favor of US yields to as tight as 3bps in late July, and after widening in mid-August, the yield spread is narrowing toward the 3bp mark. In other words, the Bank of Canada is expected to be neck-and-neck with the Federal Reserve looking 2-years into the future, but the trend of each central bank’s actions favor the Bank of Canada as being more hawkish and thereby leading the spread and possibly strengthen the CAD further.
Join Tyler at his Daily Closing Bell webinars at 3 pm ET to discuss key market developments.
The yield on the front end of the CA yield curve is one very helpful way of looking at the Canadian Dollar; the chart seems to show a significant resumption of the downtrend. Traders should keep an eye on support levels that were carved out in the last week of August. Namely, the August 29 low of 1.2550 to the August 25 low of 1.2440. A break and close below this zone would signal Canadian Dollar strength in a similar vein as was seen between May and July.
Only a break and close above the zone that includes the high traded at on Thursday morning before GDP at 1.2663, and the August 18 high of 1.2691 could we confidently say that the crises for USD/CAD bulls have been averted and that support may confidently be found in the 1.24/25 zone. You can see the resistance highlighted on the chart below, and you can see there is a battle in the works as to whether or not support will hold or the downtrend will resume.
240m USD/CAD Chart: Trendline from corrective highs may resistance further advances
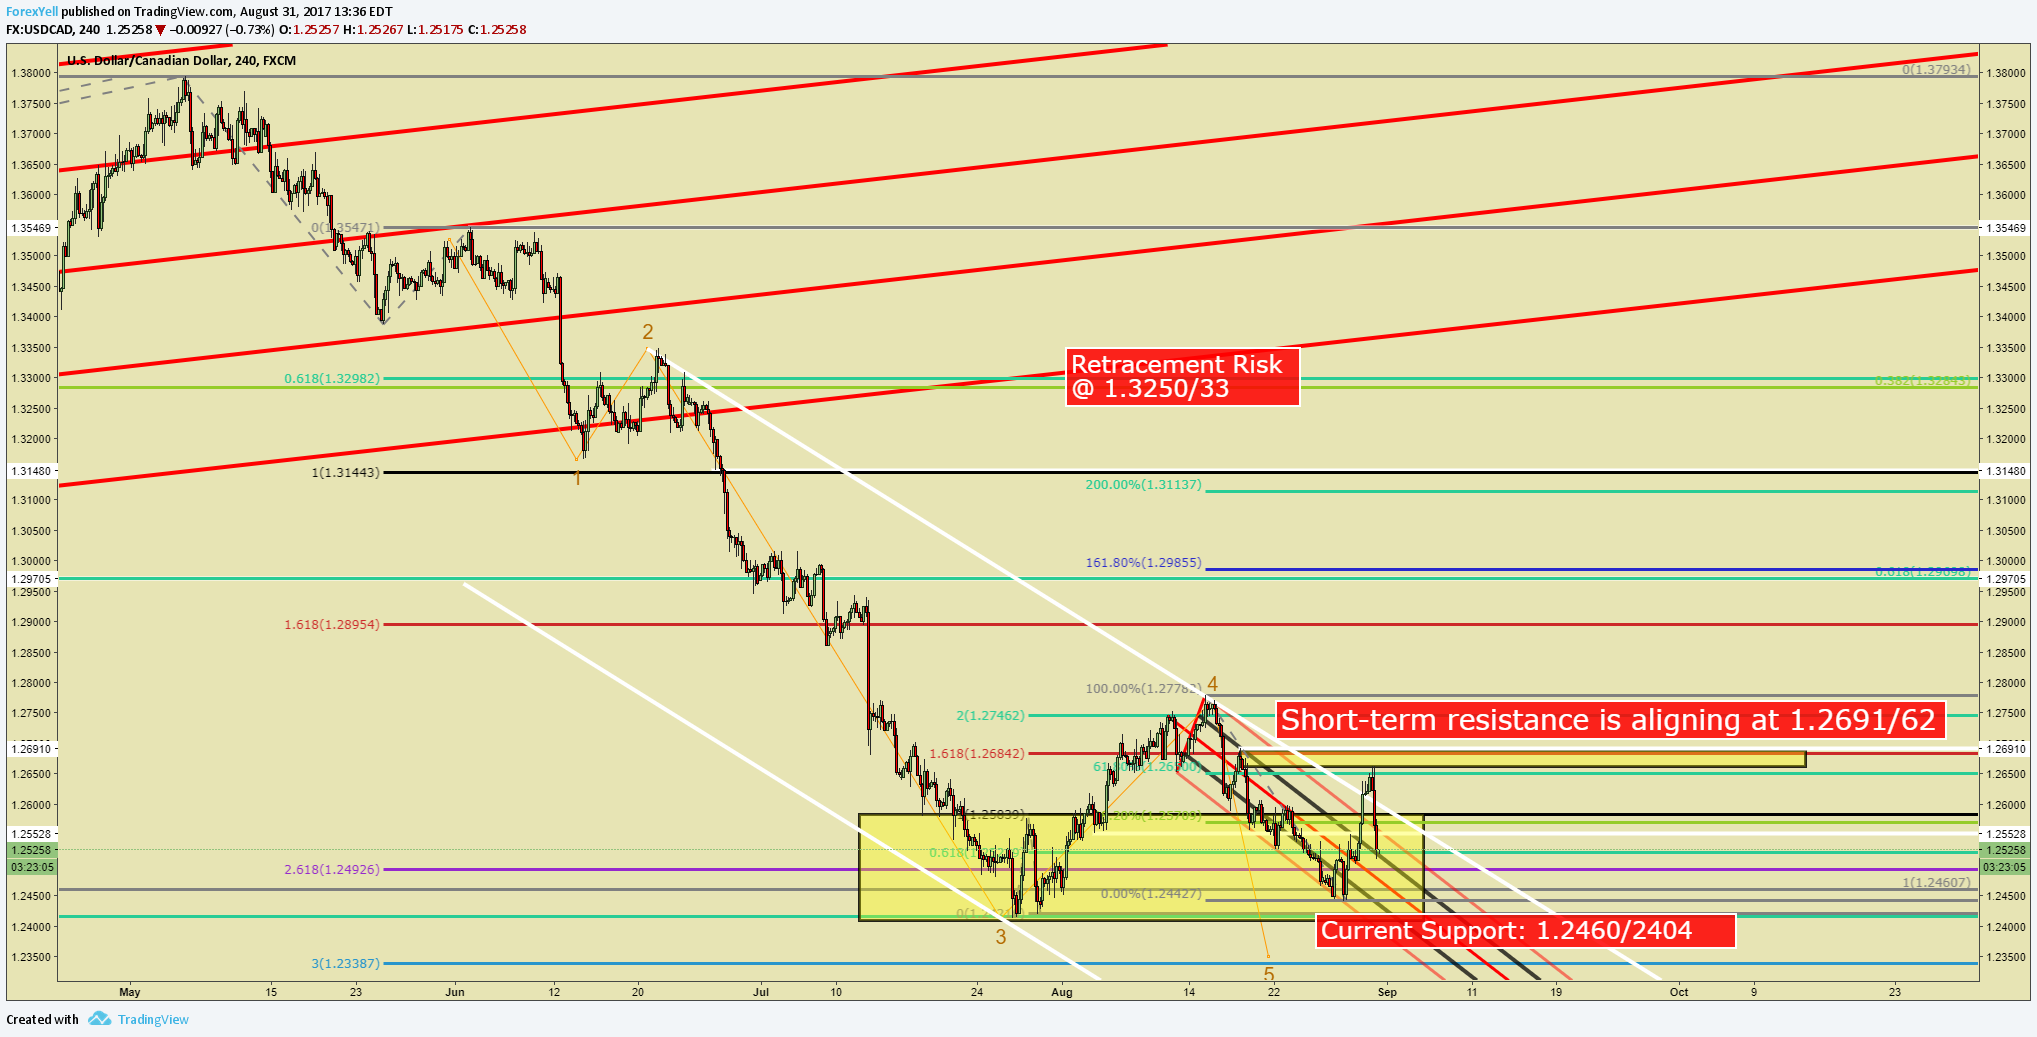
Chart Created by Tyler Yell, CMT
USD/CAD Insight from IG Client Positioning: 34% decrease in weekly short exposure favors contrarian downside bias
The sentiment highlight section is designed to help you see how DailyFX utilizes the insights derived from IG Client Sentiment, and how client positioning can lead to trade ideas. If you have any questions on this indicator, you are welcome to reach out to the author of this article with questions at tyell@dailyfx.com.

USDCAD: Retail trader data shows 76.0% of traders are net-long with the ratio of traders long to short at 3.16 to 1. In fact, traders have remained net-long since Jun 07 when USDCAD traded near 1.34832; price has moved 7.1% lower since then. The number of traders net-long is 10.8% lower than yesterday and 4.4% lower from last week, while the number of traders net-short is 9.5% lower than yesterday and 40.9% lower from last week.
We typically take a contrarian view to crowd sentiment, and the fact traders are net-long suggests USDCAD prices may continue to fall. Positioning is less net-long than yesterday but more net-long from last week. The combination of current sentiment and recent changes gives us a further mixed USDCAD trading bias.
—
Written by Tyler Yell, CMT, Currency Analyst Trading Instructor for DailyFX.com
To receive Tyler’s analysis directly via email, please SIGN UP HERE
Contact and discuss markets with Tyler on Twitter: @ForexYell


What’s inside:
- EURUSD broke the ‘neckline’ of a bearish ‘head-and-shoulders’ pattern, April trend-line
- Resistance in vicinity of 11825/80 likely to keep a lid on further strength
- Targeting the low to mid-11600s with more selling
Confidence is essential to successful trading, see this new guide – ’Building Confidence in Trading’.
Coming into last week we pointed out the likelihood of finally seeing a resolution of the range EURUSD had been stuck in for the past few weeks, and one of the outcomes we made note of as a possibility was for the triggering of a ’head-and-shoulders’ pattern. Indeed, we saw a break of the ’neckline’ along with a drop below the April trend-line. This led to decent selling before a minor bounce took shape during the latter part of last week.
Looking ahead to next week the euro is set up for further losses as the path of least resistance has turned lower. Looking to a capper on any further strength there is resistance in the 11825-11880 area (old support becomes new resistance). As long as the euro stays below this area a downward bias will remain firmly intact.
Looking lower towards support eyes will be on the August low at 11662 and the 2016 high of 11616, of which the latter just happens to align almost precisely with the measured move target of the ‘head-and-shoulders’ pattern (determined by subtracting the height of the pattern from the neckline).
Bottom line: Shorts look set to have the upperhand as a fresh month gets underway as long as the euro remains capped by resistance. On weakness, we’ll be watching how the euro responds to a drop into support levels.
For a longer-term outlook on EURUSD, check out the just released Q4 Forecast.
EURUSD: Daily

—Written by Paul Robinson, Market Analyst
You can receive Paul’s analysis directly via email bysigning up here.
You can follow Paul on Twitter at@PaulRobinonFX.

Why and how do we use IG Client Sentiment in trading? See our guide and real-time data.
EURUSD: Retail trader data shows 37.3% of traders are net-long with the ratio of traders short to long at 1.68 to 1. In fact, traders have remained net-short since Apr 18 when EURUSD traded near 1.07831; price has moved 9.6% higher since then. The number of traders net-long is 15.4% lower than yesterday and 16.4% higher from last week, while the number of traders net-short is 0.4% higher than yesterday and 10.5% lower from last week.
We typically take a contrarian view to crowd sentiment, and the fact traders are net-short suggests EURUSD prices may continue to rise. Positioning is more net-short than yesterday but less net-short from last week. The combination of current sentiment and recent changes gives us a further mixed EURUSD trading bias.
— Written by Christopher Vecchio, CFA, Senior Currency Strategist
To contact Christopher Vecchio, e-mail cvecchio@dailyfx.com
Follow him on Twitter at @CVecchioFX
To be added to Christopher’s e-mail distribution list, please fill out this form

Why and how do we use IG Client Sentiment in trading? See our guide and real-time data.
GBPUSD: Retail trader data shows 38.2% of traders are net-long with the ratio of traders short to long at 1.62 to 1. In fact, traders have remained net-short since Sep 05 when GBPUSD traded near 1.29615; price has moved 3.4% higher since then. The number of traders net-long is 0.1% higher than yesterday and 13.4% higher from last week, while the number of traders net-short is 10.6% lower than yesterday and 18.3% lower from last week.
We typically take a contrarian view to crowd sentiment, and the fact traders are net-short suggests GBPUSD prices may continue to rise. Yet traders are less net-short than yesterday and compared with last week. Recent changes in sentiment warn that the current GBPUSD price trend may soon reverse lower despite the fact traders remain net-short.
— Written by Christopher Vecchio, CFA, Senior Currency Strategist
To contact Christopher Vecchio, e-mail cvecchio@dailyfx.com
Follow him on Twitter at @CVecchioFX
To be added to Christopher’s e-mail distribution list, please fill out this form
- Selling down on a ”deal”
- Oil product price pain is set to rise as the Strait of Hormuz stays closed into summer
- Brent crude up USD 9/bl on the week… ”deal around the corner” narrative fades
- Market Still Betting on Timely Resolution, But Each Day Raises Shortage Risk
- TACO (or Whatever It Was) Sends Oil Lower — Iran Keeps Choking Hormuz
-
Analys från DailyFX11 år ago
EUR/USD Flirts with Monthly Close Under 30 Year Trendline
-
Marknadsnyheter6 år ago
BrainCool AB (publ): erhåller bidrag (grant) om 0,9 MSEK från Vinnova för bolagets projekt inom behandling av covid-19 patienter med hög feber
-

 Marknadsnyheter3 år ago
Upptäck de bästa verktygen för att analysera Bitcoin!
-
Analys från DailyFX13 år ago
Japanese Yen Breakout or Fakeout? ZAR/JPY May Provide the Answer
-

 Marknadsnyheter3 år ago
Därför föredrar svenska spelare att spela via mobiltelefonen
-
Analys från DailyFX13 år ago
Price & Time: Key Levels to Watch in the Aftermath of NFP
-
Analys från DailyFX9 år ago
Gold Prices Falter at Resistance: Is the Bullish Run Finished?
-
 Nyheter8 år ago
Teknisk analys med Martin Hallström och Nils Brobacke