
Analys från DailyFX
Bank Of Canada Lifts Rates To 1%, CAD Likely To Test 1.20 To USD
Key Takeaways:
- USD/CAD technical strategy: former support (1.2450) now acting as new resistance
- Bank of Canada raises rates again sending bears in the woods
- Momentum is a cruel foe to traders who fight its force
- IGCS Highlight: USD/CAD66% net-long exposure favors contrarian downside bias
To paraphrase the proverb, the fear of momentum is often the beginning of wisdom for trend followers. Thanks to trend following indicators like Ichimoku (chart below), it is easy to see the strength of the downtrend that began to gain steam in June though turned in May. USD/CAD has fallen by over 12% from the year to date high in early May, and some may have seen today’s move is an acclamation point, but there is little evidence that the trend is turning.
What will happen to the USD as other central banks begin normalization? Click here to see our latest forecasts and find out what trades are developing in this new environment!
While it was not fully priced then, the Bank of Canada decided to hike the reference rate by 25 basis points to 1%, which caused USD/CAD to fall like a giant rock in water. The Bank of Canada noted recent economic data has been stronger than expected, which supported their view that growth in Canada is becoming broad-based and self-sustaining and not in need of an accommodative monetary policy.
The Bank of Canada did note that inflation currently remains below 2% and that they would keep an eye on historical extremes and housing appreciation leading to increased indebtedness, which securely sensitive to higher interest rates.
As many know, the world of foreign-exchange is relative in nature. No developed market is writing comfortably above the central banks inflation target. The hawkish tightening, a phrase nearly absent from central bankers dictionaries since the Great Financial Crisis, from the Bank of Canada gives us a glimpse of how central banks may handle the new normal economy. In short, we seem heading for growth despite low inflation as technological increases are subduing many inflation pressures outside of the housing market.
In a change of events, the downside risks to Canada seem to stem from exposure to the United States, which does not necessarily favor buying USD/CAD.
Lastly, the Bank of Canada estimates their neutral nominal policy rate at 2.5 to 3.5% which would be another 6 to 10 hikes away from the current levels. Naturally, this is on the longer-term horizon as only two more hikes are priced in by the end of 2018 per the overnight index swap (OIS) market. However, CAD strength appears to be the clean play, especially against weaker currencies.
Technical Notes:
Wednesday’s USD/CAD range hit 280 pips as the markets digested the somewhat surprising hike thatwas not fully priced then. Either way, the move and likely close below 1.2329 helps to continue to frame this move as downward impulsive in nature and not worth fighting.
The current bearish move is an excellent example of the fallacy that fighting momentum in progress is a favorable strategy. Traders are often better served waiting for evidence that the trend is turning before trading a turn.
Former support at 1.2450/15 will act as new resistance. As real money sellers come into the fold of the USD/CAD picture, it is fair to argue that the trend could extend to and below 1.2000.
The long-term target is 100% extension from the May high of the initial 2016 drop that targets 1.1565. Lastly, while the move seems sharp, the initial 2016 move had already expired in terms of time compared to the current move. A 1.618 time extension would favor Canadian dollar strength lasting at least until late 2016, and specifically late-October.
Daily USD/CAD Chart: Momentum is cruel to the trader who fights it
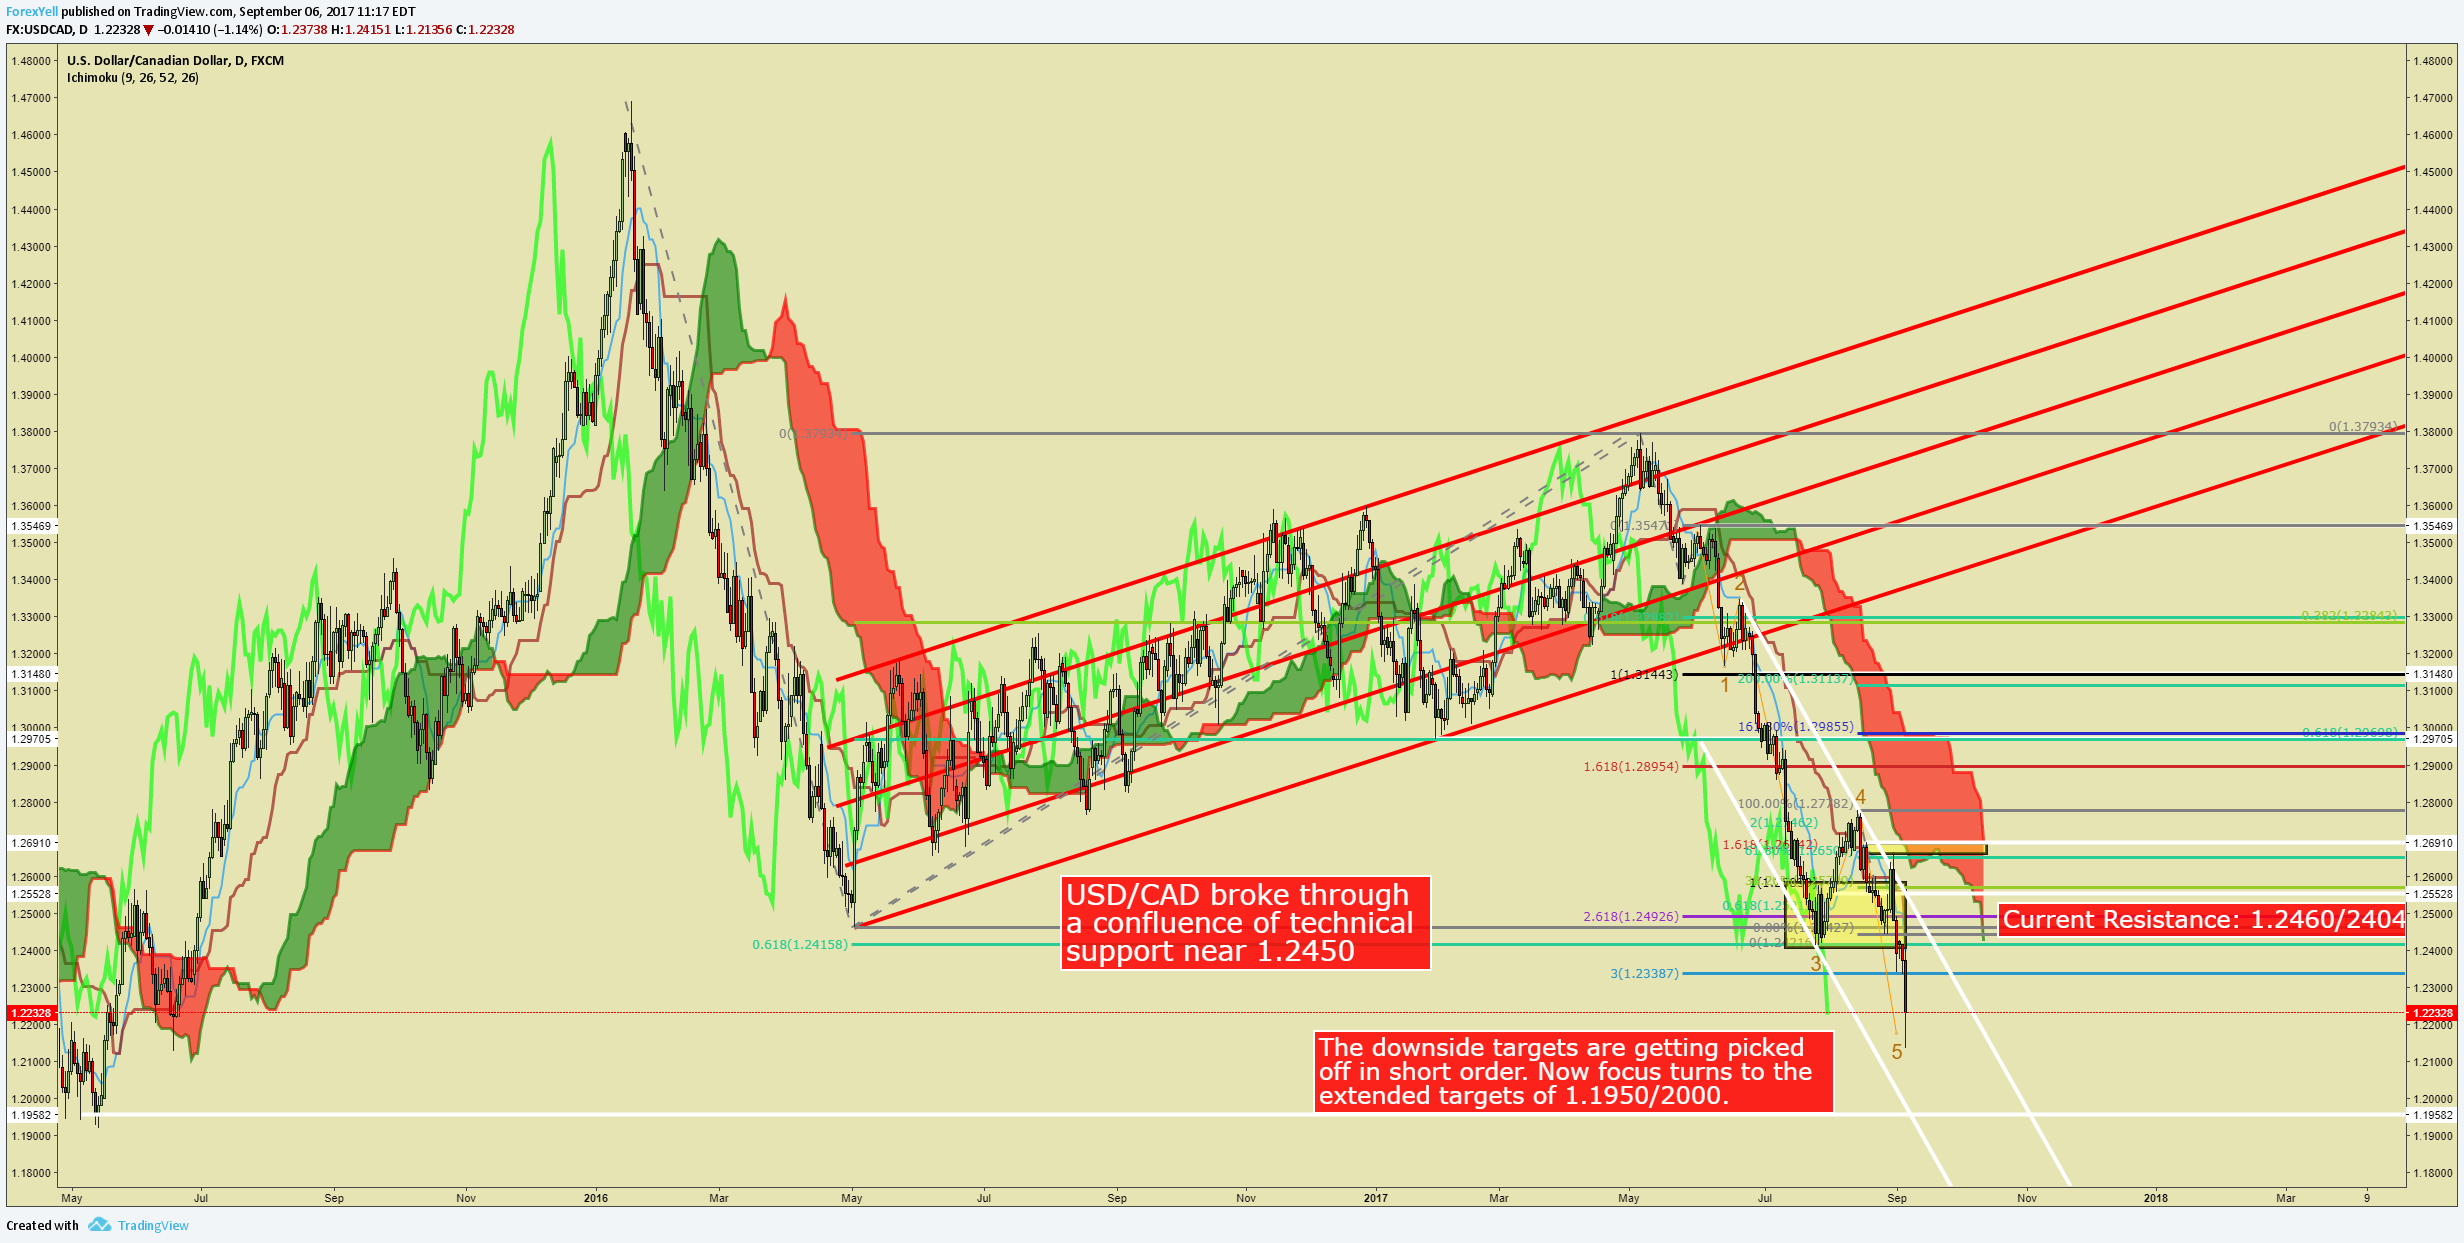
Chart Created by Tyler Yell, CMT
USD/CAD Insight from IG Client Positioning: 66% net-long exposure favors contrarian downside bias
The sentiment highlight section is designed to help you see how DailyFX utilizes the insights derived from IG Client Sentiment, and how client positioning can lead to trade ideas. If you have any questions on this indicator, you are welcome to reach out to the author of this article with questions at tyell@dailyfx.com.

USDCAD: Retail trader data shows 66.0% of traders are net-long with the ratio of traders long to short at 1.94 to 1. In fact, traders have remained net-long since Jun 07 when USDCAD traded near 1.34092; price has moved 9.0% lower since then. The number of traders net-long is 1.6% higher than yesterday and 4.7% lower from last week, while the number of traders net-short is 7.4% lower than yesterday and 35.0% higher from last week.
We typically take a contrarian view to crowd sentiment, and the fact traders are net-long suggests USDCAD prices may continue to fall. Positioning is more net-long than yesterday but less net-long from last week. The combination of current sentiment and recent changes gives us a further mixed USDCAD trading bias (emphasis added.)
—
Written by Tyler Yell, CMT, Currency Analyst Trading Instructor for DailyFX.com


What’s inside:
- EURUSD broke the ‘neckline’ of a bearish ‘head-and-shoulders’ pattern, April trend-line
- Resistance in vicinity of 11825/80 likely to keep a lid on further strength
- Targeting the low to mid-11600s with more selling
Confidence is essential to successful trading, see this new guide – ’Building Confidence in Trading’.
Coming into last week we pointed out the likelihood of finally seeing a resolution of the range EURUSD had been stuck in for the past few weeks, and one of the outcomes we made note of as a possibility was for the triggering of a ’head-and-shoulders’ pattern. Indeed, we saw a break of the ’neckline’ along with a drop below the April trend-line. This led to decent selling before a minor bounce took shape during the latter part of last week.
Looking ahead to next week the euro is set up for further losses as the path of least resistance has turned lower. Looking to a capper on any further strength there is resistance in the 11825-11880 area (old support becomes new resistance). As long as the euro stays below this area a downward bias will remain firmly intact.
Looking lower towards support eyes will be on the August low at 11662 and the 2016 high of 11616, of which the latter just happens to align almost precisely with the measured move target of the ‘head-and-shoulders’ pattern (determined by subtracting the height of the pattern from the neckline).
Bottom line: Shorts look set to have the upperhand as a fresh month gets underway as long as the euro remains capped by resistance. On weakness, we’ll be watching how the euro responds to a drop into support levels.
For a longer-term outlook on EURUSD, check out the just released Q4 Forecast.
EURUSD: Daily

—Written by Paul Robinson, Market Analyst
You can receive Paul’s analysis directly via email bysigning up here.
You can follow Paul on Twitter at@PaulRobinonFX.

Why and how do we use IG Client Sentiment in trading? See our guide and real-time data.
EURUSD: Retail trader data shows 37.3% of traders are net-long with the ratio of traders short to long at 1.68 to 1. In fact, traders have remained net-short since Apr 18 when EURUSD traded near 1.07831; price has moved 9.6% higher since then. The number of traders net-long is 15.4% lower than yesterday and 16.4% higher from last week, while the number of traders net-short is 0.4% higher than yesterday and 10.5% lower from last week.
We typically take a contrarian view to crowd sentiment, and the fact traders are net-short suggests EURUSD prices may continue to rise. Positioning is more net-short than yesterday but less net-short from last week. The combination of current sentiment and recent changes gives us a further mixed EURUSD trading bias.
— Written by Christopher Vecchio, CFA, Senior Currency Strategist
To contact Christopher Vecchio, e-mail cvecchio@dailyfx.com
Follow him on Twitter at @CVecchioFX
To be added to Christopher’s e-mail distribution list, please fill out this form

Why and how do we use IG Client Sentiment in trading? See our guide and real-time data.
GBPUSD: Retail trader data shows 38.2% of traders are net-long with the ratio of traders short to long at 1.62 to 1. In fact, traders have remained net-short since Sep 05 when GBPUSD traded near 1.29615; price has moved 3.4% higher since then. The number of traders net-long is 0.1% higher than yesterday and 13.4% higher from last week, while the number of traders net-short is 10.6% lower than yesterday and 18.3% lower from last week.
We typically take a contrarian view to crowd sentiment, and the fact traders are net-short suggests GBPUSD prices may continue to rise. Yet traders are less net-short than yesterday and compared with last week. Recent changes in sentiment warn that the current GBPUSD price trend may soon reverse lower despite the fact traders remain net-short.
— Written by Christopher Vecchio, CFA, Senior Currency Strategist
To contact Christopher Vecchio, e-mail cvecchio@dailyfx.com
Follow him on Twitter at @CVecchioFX
To be added to Christopher’s e-mail distribution list, please fill out this form
- Oil product price pain is set to rise as the Strait of Hormuz stays closed into summer
- Brent crude up USD 9/bl on the week… ”deal around the corner” narrative fades
- Market Still Betting on Timely Resolution, But Each Day Raises Shortage Risk
- TACO (or Whatever It Was) Sends Oil Lower — Iran Keeps Choking Hormuz
- Oil stress is rising as the supply chains and buffers are drained
-
Analys från DailyFX11 år ago
EUR/USD Flirts with Monthly Close Under 30 Year Trendline
-
Marknadsnyheter6 år ago
BrainCool AB (publ): erhåller bidrag (grant) om 0,9 MSEK från Vinnova för bolagets projekt inom behandling av covid-19 patienter med hög feber
-

 Marknadsnyheter3 år ago
Upptäck de bästa verktygen för att analysera Bitcoin!
-
Analys från DailyFX13 år ago
Japanese Yen Breakout or Fakeout? ZAR/JPY May Provide the Answer
-

 Marknadsnyheter3 år ago
Därför föredrar svenska spelare att spela via mobiltelefonen
-
Analys från DailyFX13 år ago
Price & Time: Key Levels to Watch in the Aftermath of NFP
-
Analys från DailyFX9 år ago
Gold Prices Falter at Resistance: Is the Bullish Run Finished?
-
 Nyheter8 år ago
Teknisk analys med Martin Hallström och Nils Brobacke