
Analys från DailyFX
Crude Oil Price Attempts Sharp Recovery, Faces $50-Level and 200 DMA
Key Takeaways:
- Crude OIl technical strategy: hesitant to buy below 200-DMA/ $50/bbl psych level
- WTI Crude Oil closes gap with Brent Oil, both moving higher
- 200-DMA for Crude Oil at $51.06, trendline resistance at $49.79/bbl
- IGCS Highlight: USOIL sharp decrease in net-short position keeps ST focus higher
Talk about bad timing. Data from the CFTC showed that the net-speculative positioning data for Crude futures contractsreported a 75,983 contract drop in bullish oil exposure. The reduction of long positions was the largest on record. In other words, hedge funds that trade crude oil are having a bad week.
Since last Tuesday, when data from the CFTC is collected, the price of crude oil has rebounded 8%. There remains a lot of confusion as to the future direction of crude oil given that the historical “boom/bust” cycle is being questioned due to the large increase in global supply from the hands of shell producers.
Despite the concerns that Hurricane Harvey would leave the gasoline market as many refineries were flooded and temporarily put offline, there was little to no concern that there be a shortage of oil. Recent inventory data showed there is no shortage of crude, just difficulty in the delivery of refined products.
Much of the volatility around Crude Oil has been on the US Benchmark, WTI. Brent Oil, the global standard remained firm, and the spread between WTI and Brent oil was the widest levels in two years over the past week. Therefore, the gap appears to be closing and doing so with both oil markets moving higher.
As Hurricane Season gets in full swing, check out our free forecast on Crude Oil prices
Either way, the price of crude oil has significant resistance points ahead when looking at the chart below.
Based on internal price action, I was keeping an eye on $48.15 per barrel, which was a terminating price of the triangle before the recent breakdown below $46 a barrel. As of last Thursday, we saw a sharp spike that led to the 8% rally with spoke about earlier as price cleared the internal resistance of $48.15 to trade as high as $49.39 on Wednesday.
There is a confluence of resistance levels to watch between $49.67, which is the 200-day moving average, and the late July high of $50.20 per barrel. Between these two levels, there remains trendline resistance and Fibonacci levels that could resist a further price increase. One component that is helping the price of oil to remain supported is the weak US dollar.
Concerns remain that the US dollar could be in a longer term downtrend as opposed to a correction, which would likely provide longer-term support for commodities priced in dollars. Either way, the oil supply glut seems here to stay that can make it difficult for the price of oil to rally firmly into the $50 per barrel zone.
While keeping an eye on the multiple levels of resistance, a break and close below $45.38 would resume the 2017 downtrend, which is yet to be invalidated as we consistently see lower lows and lower highs throughout the 2017.
Daily USOil Chart:
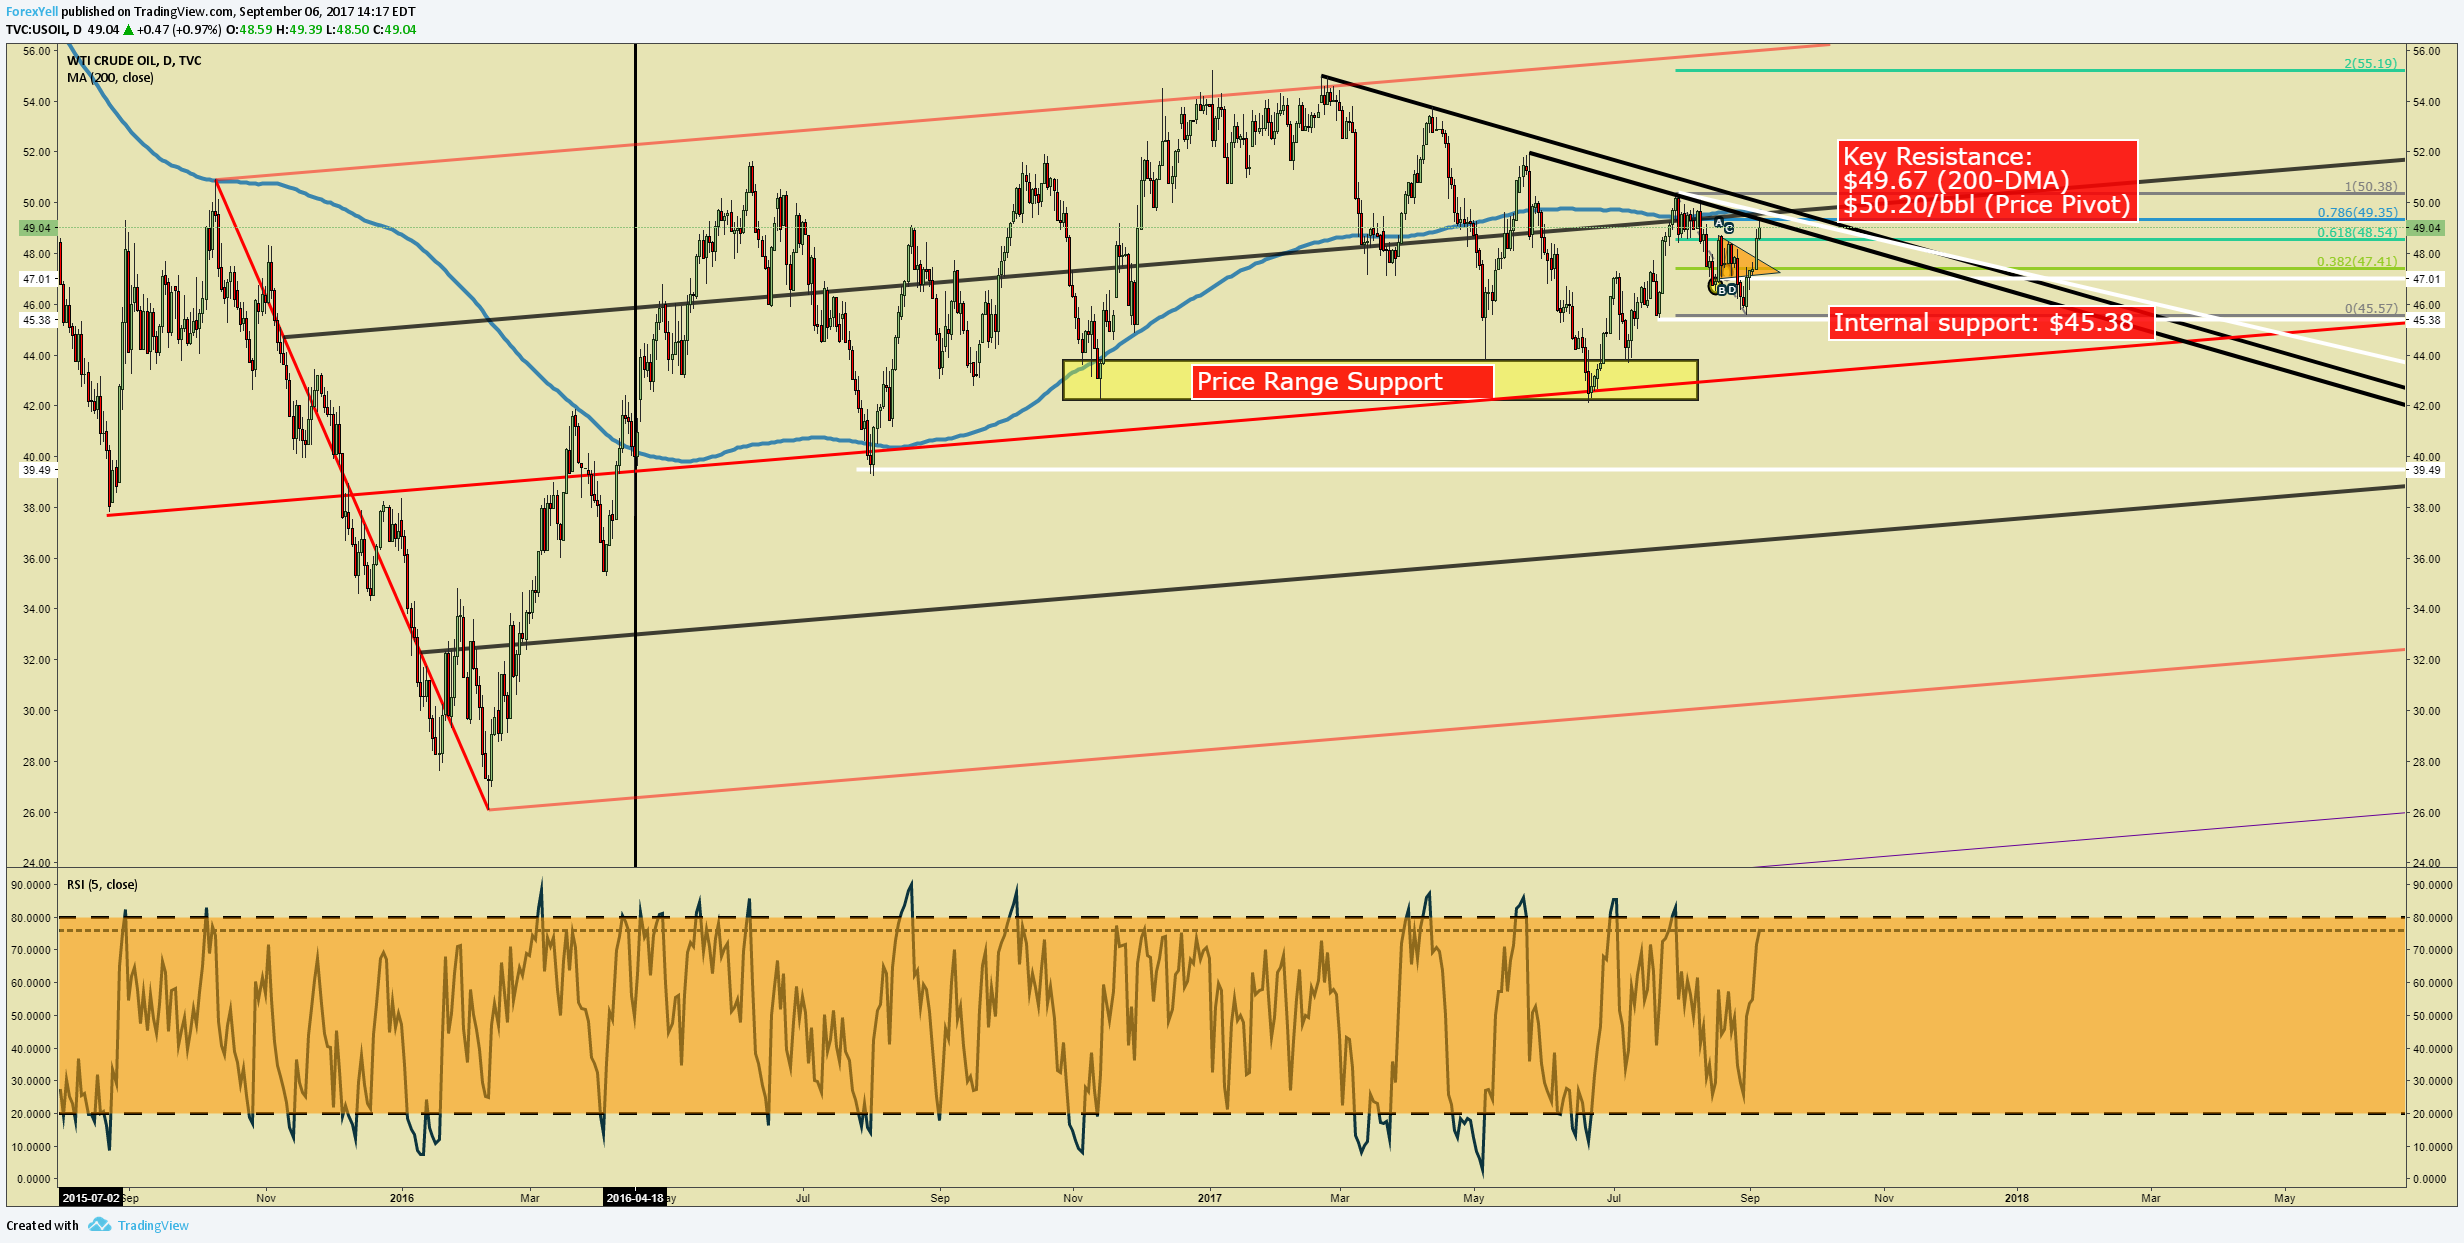
Chart Created by Tyler Yell, CMT
US Oil Insight from IG Client Positioning: sharp decrease in net-short position keeps ST focus higher.
The sentiment highlight section is designed to help you see how DailyFX utilizes the insights derived from IG Client Sentiment, and how client positioning can lead to trade ideas. If you have any questions on this indicator, you are welcome to reach out to the author of this article with questions at tyell@dailyfx.com.

Retail trader data shows 55.1% of traders are net-long with the ratio of traders long to short at 1.23 to 1. In fact, traders have remained net-long since Aug 14 when Oil – US Crude traded near 4894.0; price has moved 0.9% higher since then. The number of traders net-long is 19.5% lower than yesterday and 36.6% lower from last week, while the number of traders net-short is 24.7% higher than yesterday and 53.2% higher from last week.
We typically take a contrarian view to crowd sentiment, and the fact traders are net-long suggests Oil – US Crude prices may continue to fall. Yet traders are less net-long than yesterday and compared with last week. Recent changes in sentiment warn that the current Oil – US Crude price trend may soon reverse higher despite the fact traders remain net-long. (emphasis added.)
—
Written by Tyler Yell, CMT, Currency Analyst Trading Instructor for DailyFX.com
To receive Tyler’s analysis directly via email, please SIGN UP HERE
Contact and discuss markets with Tyler on Twitter: @ForexYell


What’s inside:
- EURUSD broke the ‘neckline’ of a bearish ‘head-and-shoulders’ pattern, April trend-line
- Resistance in vicinity of 11825/80 likely to keep a lid on further strength
- Targeting the low to mid-11600s with more selling
Confidence is essential to successful trading, see this new guide – ’Building Confidence in Trading’.
Coming into last week we pointed out the likelihood of finally seeing a resolution of the range EURUSD had been stuck in for the past few weeks, and one of the outcomes we made note of as a possibility was for the triggering of a ’head-and-shoulders’ pattern. Indeed, we saw a break of the ’neckline’ along with a drop below the April trend-line. This led to decent selling before a minor bounce took shape during the latter part of last week.
Looking ahead to next week the euro is set up for further losses as the path of least resistance has turned lower. Looking to a capper on any further strength there is resistance in the 11825-11880 area (old support becomes new resistance). As long as the euro stays below this area a downward bias will remain firmly intact.
Looking lower towards support eyes will be on the August low at 11662 and the 2016 high of 11616, of which the latter just happens to align almost precisely with the measured move target of the ‘head-and-shoulders’ pattern (determined by subtracting the height of the pattern from the neckline).
Bottom line: Shorts look set to have the upperhand as a fresh month gets underway as long as the euro remains capped by resistance. On weakness, we’ll be watching how the euro responds to a drop into support levels.
For a longer-term outlook on EURUSD, check out the just released Q4 Forecast.
EURUSD: Daily

—Written by Paul Robinson, Market Analyst
You can receive Paul’s analysis directly via email bysigning up here.
You can follow Paul on Twitter at@PaulRobinonFX.

Why and how do we use IG Client Sentiment in trading? See our guide and real-time data.
EURUSD: Retail trader data shows 37.3% of traders are net-long with the ratio of traders short to long at 1.68 to 1. In fact, traders have remained net-short since Apr 18 when EURUSD traded near 1.07831; price has moved 9.6% higher since then. The number of traders net-long is 15.4% lower than yesterday and 16.4% higher from last week, while the number of traders net-short is 0.4% higher than yesterday and 10.5% lower from last week.
We typically take a contrarian view to crowd sentiment, and the fact traders are net-short suggests EURUSD prices may continue to rise. Positioning is more net-short than yesterday but less net-short from last week. The combination of current sentiment and recent changes gives us a further mixed EURUSD trading bias.
— Written by Christopher Vecchio, CFA, Senior Currency Strategist
To contact Christopher Vecchio, e-mail cvecchio@dailyfx.com
Follow him on Twitter at @CVecchioFX
To be added to Christopher’s e-mail distribution list, please fill out this form

Why and how do we use IG Client Sentiment in trading? See our guide and real-time data.
GBPUSD: Retail trader data shows 38.2% of traders are net-long with the ratio of traders short to long at 1.62 to 1. In fact, traders have remained net-short since Sep 05 when GBPUSD traded near 1.29615; price has moved 3.4% higher since then. The number of traders net-long is 0.1% higher than yesterday and 13.4% higher from last week, while the number of traders net-short is 10.6% lower than yesterday and 18.3% lower from last week.
We typically take a contrarian view to crowd sentiment, and the fact traders are net-short suggests GBPUSD prices may continue to rise. Yet traders are less net-short than yesterday and compared with last week. Recent changes in sentiment warn that the current GBPUSD price trend may soon reverse lower despite the fact traders remain net-short.
— Written by Christopher Vecchio, CFA, Senior Currency Strategist
To contact Christopher Vecchio, e-mail cvecchio@dailyfx.com
Follow him on Twitter at @CVecchioFX
To be added to Christopher’s e-mail distribution list, please fill out this form
- Oil product price pain is set to rise as the Strait of Hormuz stays closed into summer
- Brent crude up USD 9/bl on the week… ”deal around the corner” narrative fades
- Market Still Betting on Timely Resolution, But Each Day Raises Shortage Risk
- TACO (or Whatever It Was) Sends Oil Lower — Iran Keeps Choking Hormuz
- Oil stress is rising as the supply chains and buffers are drained
-
Analys från DailyFX11 år ago
EUR/USD Flirts with Monthly Close Under 30 Year Trendline
-
Marknadsnyheter6 år ago
BrainCool AB (publ): erhåller bidrag (grant) om 0,9 MSEK från Vinnova för bolagets projekt inom behandling av covid-19 patienter med hög feber
-

 Marknadsnyheter3 år ago
Upptäck de bästa verktygen för att analysera Bitcoin!
-
Analys från DailyFX13 år ago
Japanese Yen Breakout or Fakeout? ZAR/JPY May Provide the Answer
-

 Marknadsnyheter3 år ago
Därför föredrar svenska spelare att spela via mobiltelefonen
-
Analys från DailyFX13 år ago
Price & Time: Key Levels to Watch in the Aftermath of NFP
-
Analys från DailyFX9 år ago
Gold Prices Falter at Resistance: Is the Bullish Run Finished?
-
 Nyheter8 år ago
Teknisk analys med Martin Hallström och Nils Brobacke