
Analys från DailyFX
USD/JPY Unable to Break to New 2017 Lows Despite Weak USD & Sentiment
Key Takeaways:
- USD/JPY technical strategy: 12-month trendline working to hold up USD/JPY
- USD/JPY trading within price range of 2017 extreme day (109.05-108.13)
- Risk off sentiment has had a difficult time holding, limiting JPY strength
- IGCS Highlight: USD/JPY 75% net-long exposure favors contrarian downside bias
Despite the weak USD, the Japanese Yen has followed suit and remained weak as well. Over the last two weeks, the only currencies that have consistently weakened against the US Dollar as other strengthened were the New Zealand dollar and Japanese yen. While the New Zealand dollar has strengthened this week, the Yen appears the odd man out.
A persistent theme that we witnessed has been geopolitical shock headlines (i.e., North Korea, hurricanes, etc.), but JPY strength and risk of sentiment has failed to hold. Locally, there have been few developments outside of North Korea that are driving the Yen. The driver of the trend in USD/JPY appears to be the view that investors continue to press USD short positions.
United States economic pessimism continues to persist surrounded by the dualistic threat of monetary policy and action, or future hikes are priced out and potential debt ceiling confrontation later this month. The monetary policy caution was highlighted by Lael Brainard of the Federal Reserve Board of Governors who urged caution as she was concerned about persistently low inflation despite full employment.
Beyond concerns of the debt ceiling and monetary policy and action areconcerns that the USD is overpriced still by some of the more fundamental aspects of currency valuation. Recently, the OECD has said the dollar is roughly 13% overvalued against the EUR in terms of purchasing power parity (PPP) and was recently at a 30% premium to the yen from a PPP basis. Additionally, the current account deficit in the US compared to significant surpluses in Germany and Japan suggest a more fundamental view of a weaker USD. Lastly, the positive correlation a bond yields (TNX) and the US dollar seemed to paint a bearish picture for the USD as US Treasury yieldslook set to resume their multi-decade trend lower.
Technical Notes:
While the yen has failed to strengthen to new 2017 highs as other currencies like the EUR and Canadian Dollar have against the USD, there is focus on a recent outsized reversal and positively diverging oscillators that could help support USD/JPY as it trades against a 12–month trend line. USD/JPY is also trading within the price range of extreme day of 2017 (109.05 – 108.13). Extreme day price range can often act as strong support and has for multiple tests up USD/TTY.
However, traders may want to take advice from USD/CAD, which broke below support today to a new 2017 low (new highs for CAD), which helps place favor and the larger bearish dollar trend continuing. Resistance on a bounce in USD/JPYis focused on 110.43 – 95 which is a combination of internal resistance and Fibonacci levels.
Two important insights can be derived from chart below. First, you can see that momentum is failing to make new lows as prices test support of the 2017 extreme day price range mentioned above. Second, you also notice that the highly correlated Japanese large-cap index, Nikkei 225 is tracing a similar pattern. While not productive, the correlation favors that a bounce in the Nikkei 225 would likely align with a bounce in USD/JPY whereas a breakdown, which would support the larger USD bear trend would likely align with a drop in the Nikkei 225 that can easily be confirmed.
Daily USD/JPY Chart: Working to hold the (trend) line as risk-off sentiment fails to stick
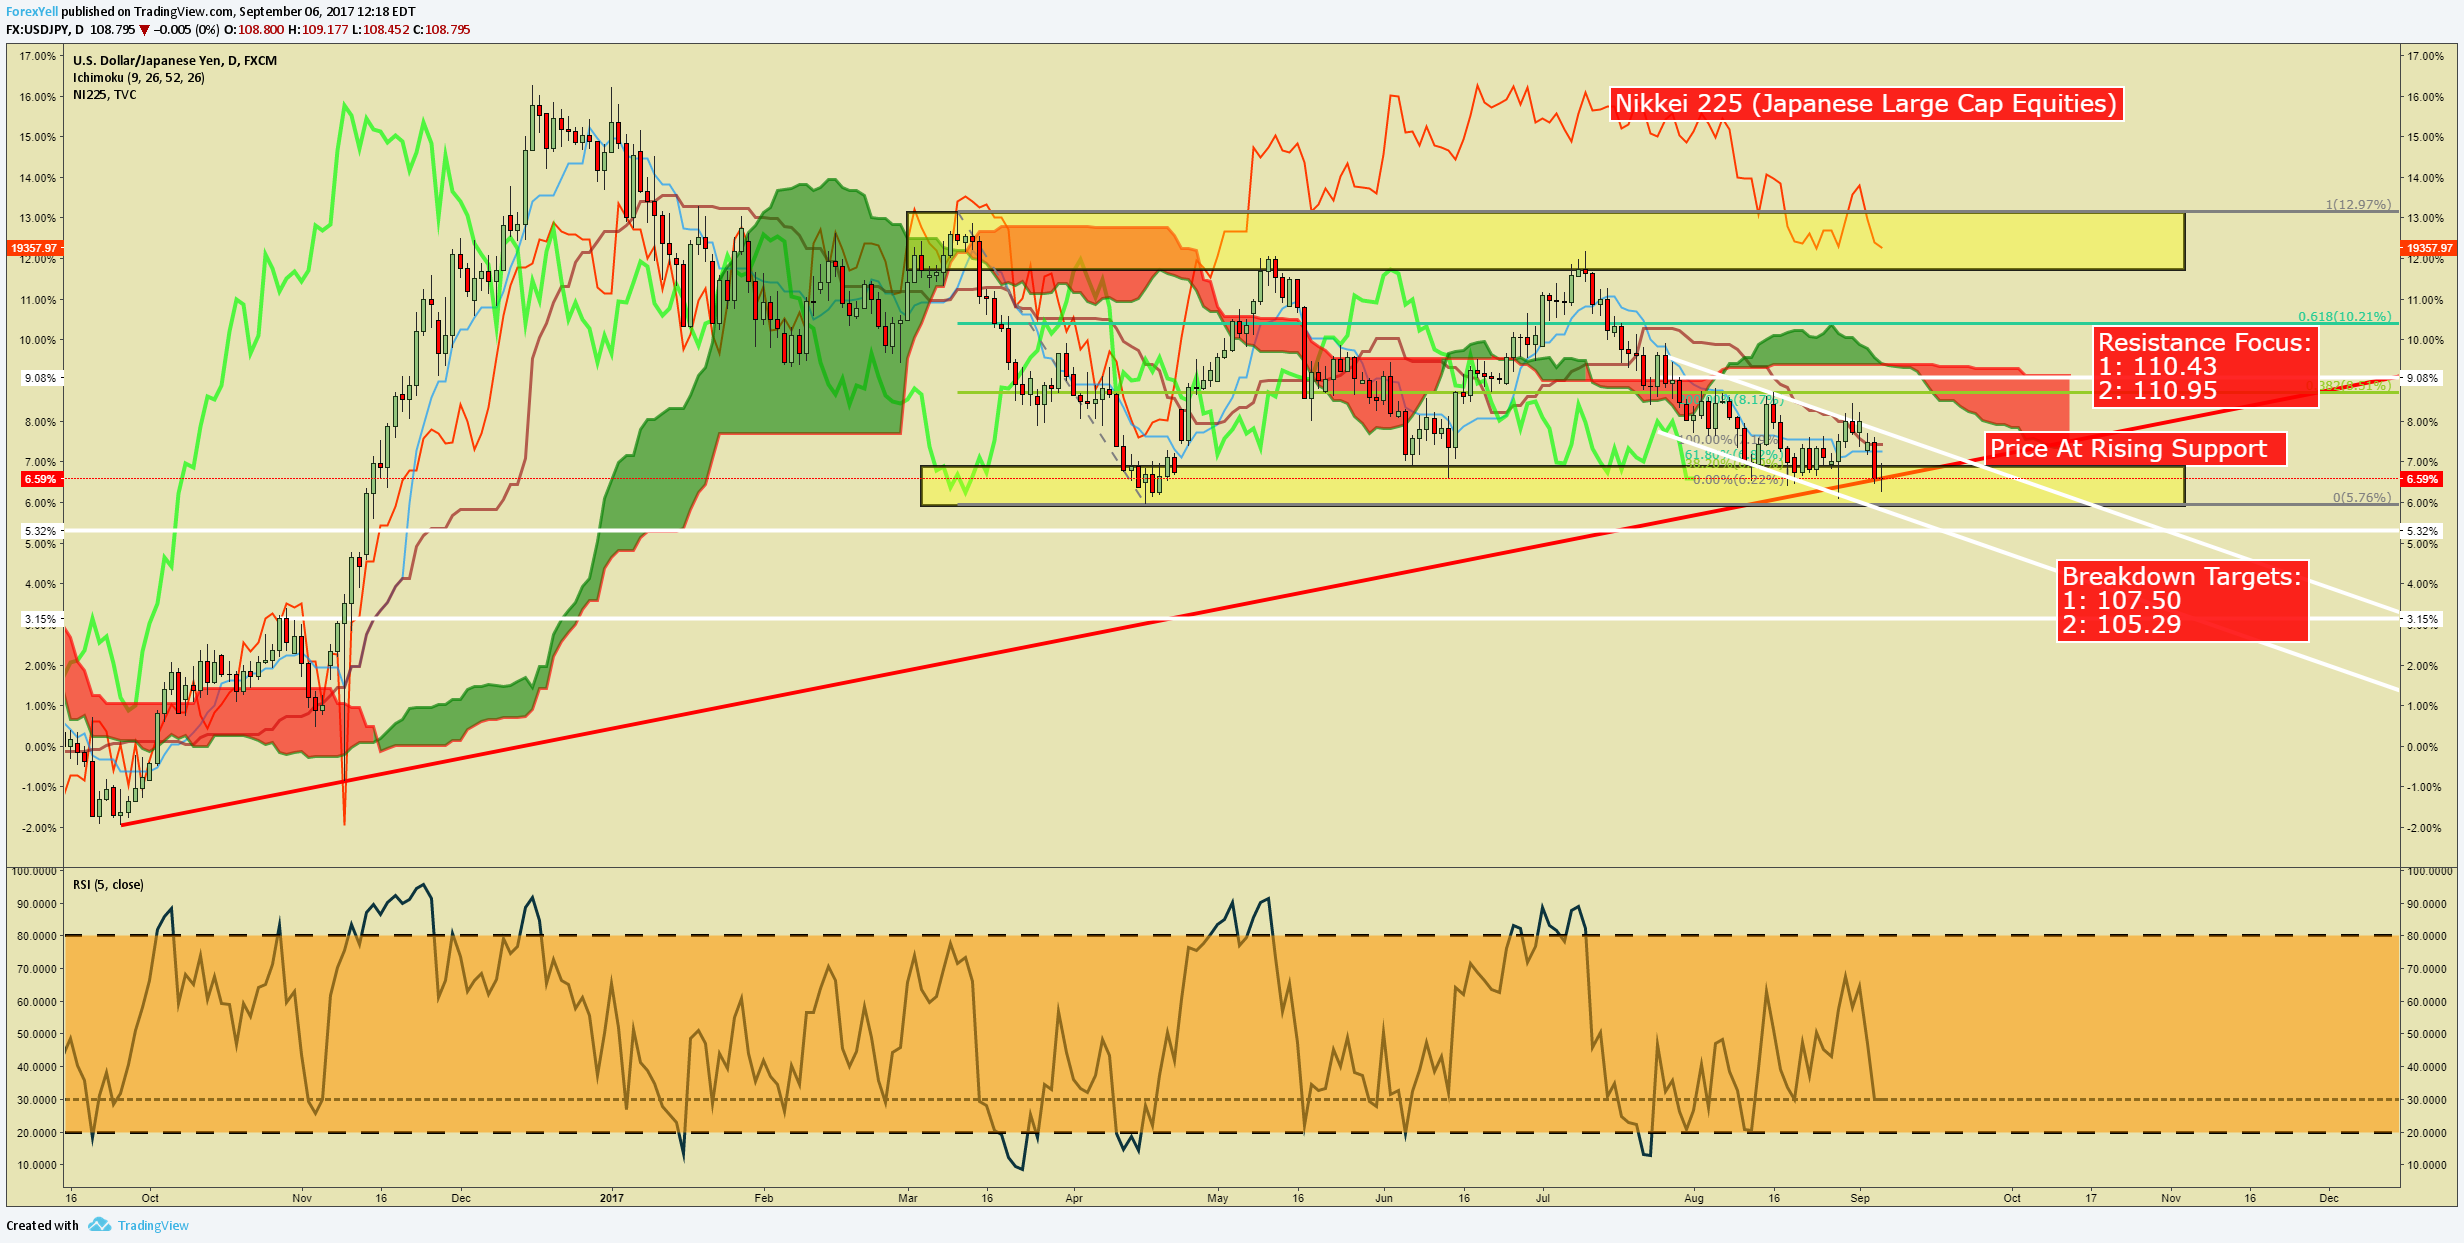
Chart Created by Tyler Yell, CMT
USD/JPY Insight from IG Client Positioning: 75% net-long exposure favors contrarian downside bias.
The sentiment highlight section is designed to help you see how DailyFX utilizes the insights derived from IG Client Sentiment, and how client positioning can lead to trade ideas. If you have any questions on this indicator, you are welcome to reach out to the author of this article with questions at tyell@dailyfx.com.

USDJPY: Retail trader data shows 75.0% of traders are net-long with the ratio of traders long to short at 2.99 to 1. In fact, traders have remained net-long since Jul 18 when USDJPY traded near 113.891; theprice has moved 4.3% lower since then. The number of traders net-long is 23.7% higher than yesterday and 27.9% higher from last week, while the number of traders net-short is 13.6% lower than yesterday and 8.3% lower from last week.
We typically take a contrarian view to crowd sentiment, and the fact traders are net-long suggests USDJPY prices may continue to fall. Traders are further net-long than yesterday and last week, and the combination of current sentiment and recent changes gives us a stronger USDJPY-bearish contrarian trading bias (emphasis added.)
—
Written by Tyler Yell, CMT, Currency Analyst Trading Instructor for DailyFX.com
To receive Tyler’s analysis directly via email, please SIGN UP HERE
Contact and discuss markets with Tyler on Twitter: @ForexYell


What’s inside:
- EURUSD broke the ‘neckline’ of a bearish ‘head-and-shoulders’ pattern, April trend-line
- Resistance in vicinity of 11825/80 likely to keep a lid on further strength
- Targeting the low to mid-11600s with more selling
Confidence is essential to successful trading, see this new guide – ’Building Confidence in Trading’.
Coming into last week we pointed out the likelihood of finally seeing a resolution of the range EURUSD had been stuck in for the past few weeks, and one of the outcomes we made note of as a possibility was for the triggering of a ’head-and-shoulders’ pattern. Indeed, we saw a break of the ’neckline’ along with a drop below the April trend-line. This led to decent selling before a minor bounce took shape during the latter part of last week.
Looking ahead to next week the euro is set up for further losses as the path of least resistance has turned lower. Looking to a capper on any further strength there is resistance in the 11825-11880 area (old support becomes new resistance). As long as the euro stays below this area a downward bias will remain firmly intact.
Looking lower towards support eyes will be on the August low at 11662 and the 2016 high of 11616, of which the latter just happens to align almost precisely with the measured move target of the ‘head-and-shoulders’ pattern (determined by subtracting the height of the pattern from the neckline).
Bottom line: Shorts look set to have the upperhand as a fresh month gets underway as long as the euro remains capped by resistance. On weakness, we’ll be watching how the euro responds to a drop into support levels.
For a longer-term outlook on EURUSD, check out the just released Q4 Forecast.
EURUSD: Daily

—Written by Paul Robinson, Market Analyst
You can receive Paul’s analysis directly via email bysigning up here.
You can follow Paul on Twitter at@PaulRobinonFX.

Why and how do we use IG Client Sentiment in trading? See our guide and real-time data.
EURUSD: Retail trader data shows 37.3% of traders are net-long with the ratio of traders short to long at 1.68 to 1. In fact, traders have remained net-short since Apr 18 when EURUSD traded near 1.07831; price has moved 9.6% higher since then. The number of traders net-long is 15.4% lower than yesterday and 16.4% higher from last week, while the number of traders net-short is 0.4% higher than yesterday and 10.5% lower from last week.
We typically take a contrarian view to crowd sentiment, and the fact traders are net-short suggests EURUSD prices may continue to rise. Positioning is more net-short than yesterday but less net-short from last week. The combination of current sentiment and recent changes gives us a further mixed EURUSD trading bias.
— Written by Christopher Vecchio, CFA, Senior Currency Strategist
To contact Christopher Vecchio, e-mail cvecchio@dailyfx.com
Follow him on Twitter at @CVecchioFX
To be added to Christopher’s e-mail distribution list, please fill out this form

Why and how do we use IG Client Sentiment in trading? See our guide and real-time data.
GBPUSD: Retail trader data shows 38.2% of traders are net-long with the ratio of traders short to long at 1.62 to 1. In fact, traders have remained net-short since Sep 05 when GBPUSD traded near 1.29615; price has moved 3.4% higher since then. The number of traders net-long is 0.1% higher than yesterday and 13.4% higher from last week, while the number of traders net-short is 10.6% lower than yesterday and 18.3% lower from last week.
We typically take a contrarian view to crowd sentiment, and the fact traders are net-short suggests GBPUSD prices may continue to rise. Yet traders are less net-short than yesterday and compared with last week. Recent changes in sentiment warn that the current GBPUSD price trend may soon reverse lower despite the fact traders remain net-short.
— Written by Christopher Vecchio, CFA, Senior Currency Strategist
To contact Christopher Vecchio, e-mail cvecchio@dailyfx.com
Follow him on Twitter at @CVecchioFX
To be added to Christopher’s e-mail distribution list, please fill out this form
- Brent crude up USD 9/bl on the week… ”deal around the corner” narrative fades
- Market Still Betting on Timely Resolution, But Each Day Raises Shortage Risk
- TACO (or Whatever It Was) Sends Oil Lower — Iran Keeps Choking Hormuz
- Oil stress is rising as the supply chains and buffers are drained
- Buy Brent Dec-2026 calls with strike $150/b!
-
Analys från DailyFX10 år ago
EUR/USD Flirts with Monthly Close Under 30 Year Trendline
-
Marknadsnyheter6 år ago
BrainCool AB (publ): erhåller bidrag (grant) om 0,9 MSEK från Vinnova för bolagets projekt inom behandling av covid-19 patienter med hög feber
-

 Marknadsnyheter3 år ago
Upptäck de bästa verktygen för att analysera Bitcoin!
-
Analys från DailyFX13 år ago
Japanese Yen Breakout or Fakeout? ZAR/JPY May Provide the Answer
-

 Marknadsnyheter3 år ago
Därför föredrar svenska spelare att spela via mobiltelefonen
-
Analys från DailyFX13 år ago
Price & Time: Key Levels to Watch in the Aftermath of NFP
-
Analys från DailyFX9 år ago
Gold Prices Falter at Resistance: Is the Bullish Run Finished?
-
 Nyheter7 år ago
Teknisk analys med Martin Hallström och Nils Brobacke