
Analys från DailyFX
Crude Oil Faces Pivotal Moment As IEA Sees Strong Oil-Demand Growth
Key Takeaways:
- Crude Oil technical strategy: watching price test 200-DMA/ $50/bbl psych level
- WTI Crude Oil gap to Brent Oil widens by most in 2-years
- 200-DMA for Crude Oil at $51.06, trendline resistance at $49.79/bbl
- IGCS Highlight: USOIL sharp decrease in net-short position keeps ST focus higher
Crude Oil appears determined to close the gap between the global oil benchmark, Brent Crude Oil. The week, the spread or difference between Brent and WTI was the widest in two years.On Wednesday, Brent’s premium over WTI to reach $5.62 a barrel compared to the 18-month average of $2-$3. Much of this can be explained by Hurricane Harvey as highlighted by Wednesday’s EIA Crude Oil Inventory report. They showed the Refinery Utilization fell to 77.7%, the lowest since 2010. Gasoline, on the other hand, was in major demand as mandatory evacuations took hold across key states in the storm’s path.
The gasoline draw brought about the largest drop in gasoline stockpiles since 1990 as utilization fell at the same time that demand for refined products jumped. Another insight from the EIA report was that US Crude imports plunged as multiple ports were blocked.
The International Energy Agency report (different from EIA Crude Oil inventory) should give a reason for optimism, which will need to be confirmed by price action (levels below). The view that global demand is forecasted to rise by 1.7% or 1.6 million bpd, the most since 2015, which is thanks to stronger consumption expectations in Europe the U.S.
As demand forecasts shift higher, check out our free forecast on Crude Oil prices
When looking at crude oil shorts, there is now reason to see how the picture could turn technically Bullish. Crude Oil has traded in 2017 in a pattern and series of lower-lows and lower-highs solidifying a downtrend. The positive component of the chart is that price has rebounded aggressively from the 2017 low of $42, and much of the price action has been an oscillation between $45-50/bbl. The specific price pivots are a support of $45.38 and resistance of $50.20.
A break of either of those levels will help to form the focus going forward. Naturally, we’ll look to Intermarket confirmation such as a strong or weak USD, and how other commodities are doing. Recently, we’ve seen strength in base metals, but recent reports from future spreads show that copper, one of the hottest performing commodities of late has benefitted from speculative fervor as opposed supply and demand.
Daily USOil Chart:
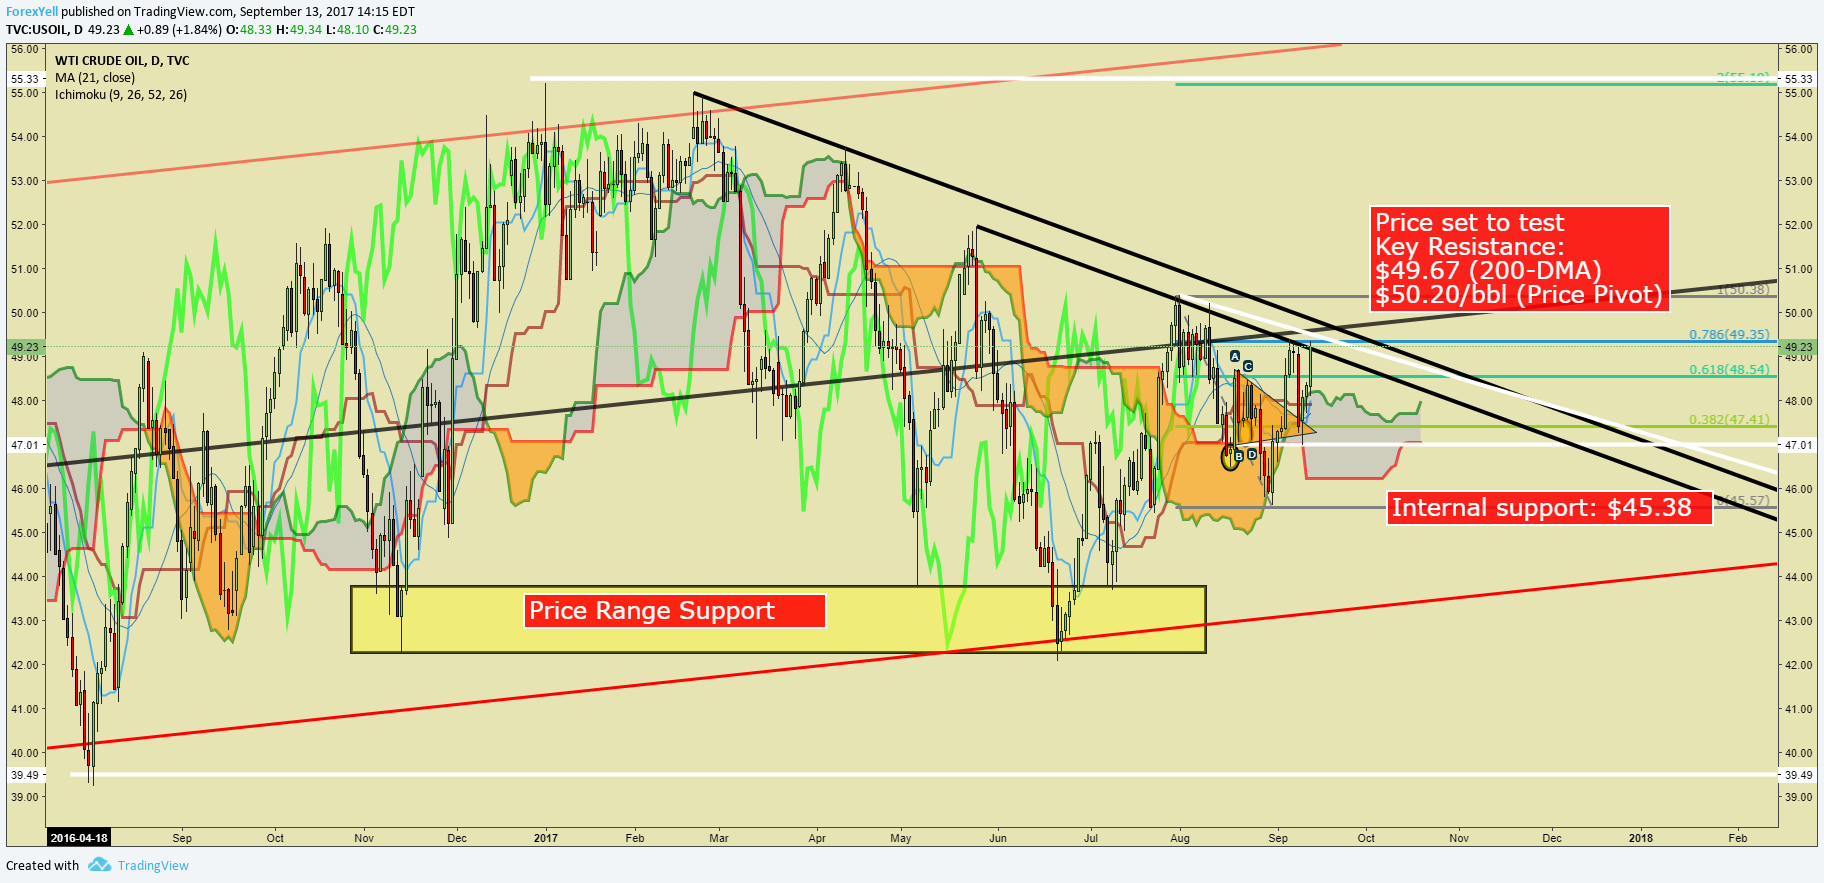
Chart Created by Tyler Yell, CMT
US Oil Insight from IG Client Positioning: sharp decrease in net-short position keeps ST focus higher
The sentiment highlight section is designed to help you see how DailyFX utilizes the insights derived from IG Client Sentiment, and how client positioning can lead to trade ideas. If you have any questions on this indicator, you are welcome to reach out to the author of this article with questions at tyell@dailyfx.com.
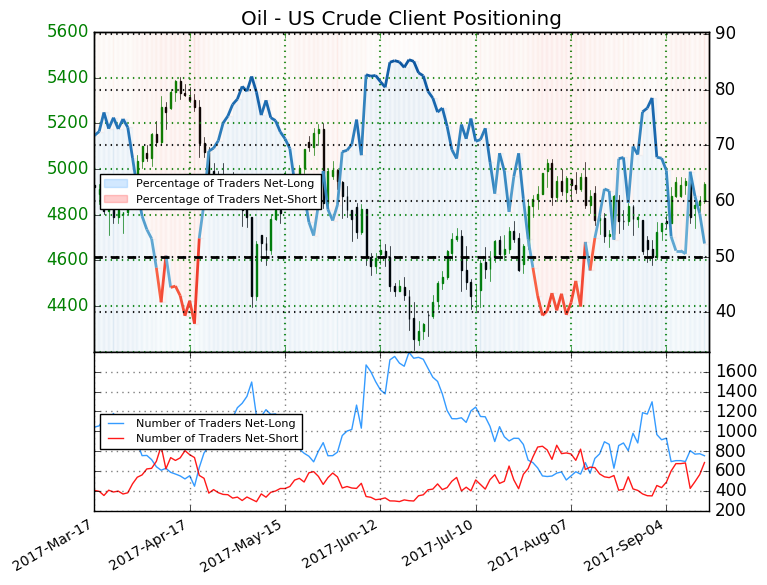
Oil – US Crude: Retail trader data shows 52.4% of traders are net-long with the ratio of traders long to short at 1.1 to 1. In fact, traders have remained net-long since Aug 14 when Oil – US Crude traded near 4840.3; price has moved 1.9% higher since then. The number of traders net-long is 8.9% lower than yesterday and 3.1% higher from last week, while the number of traders net-short is 32.0% higher than yesterday and 9.5% higher from last week.
We typically take a contrarian view to crowd sentiment, and the fact traders are net-long suggests Oil – US Crude prices may continue to fall. Yet traders are less net-long than yesterday and compared with last week. Recent changes in sentiment warn that the current Oil – US Crude price trend may soon reverse higher despite the fact traders remain net-long (emphasis added.)
—
Written by Tyler Yell, CMT, Currency Analyst Trading Instructor for DailyFX.com
To receive Tyler’s analysis directly via email, please SIGN UP HERE
Contact and discuss markets with Tyler on Twitter: @ForexYell


What’s inside:
- EURUSD broke the ‘neckline’ of a bearish ‘head-and-shoulders’ pattern, April trend-line
- Resistance in vicinity of 11825/80 likely to keep a lid on further strength
- Targeting the low to mid-11600s with more selling
Confidence is essential to successful trading, see this new guide – ’Building Confidence in Trading’.
Coming into last week we pointed out the likelihood of finally seeing a resolution of the range EURUSD had been stuck in for the past few weeks, and one of the outcomes we made note of as a possibility was for the triggering of a ’head-and-shoulders’ pattern. Indeed, we saw a break of the ’neckline’ along with a drop below the April trend-line. This led to decent selling before a minor bounce took shape during the latter part of last week.
Looking ahead to next week the euro is set up for further losses as the path of least resistance has turned lower. Looking to a capper on any further strength there is resistance in the 11825-11880 area (old support becomes new resistance). As long as the euro stays below this area a downward bias will remain firmly intact.
Looking lower towards support eyes will be on the August low at 11662 and the 2016 high of 11616, of which the latter just happens to align almost precisely with the measured move target of the ‘head-and-shoulders’ pattern (determined by subtracting the height of the pattern from the neckline).
Bottom line: Shorts look set to have the upperhand as a fresh month gets underway as long as the euro remains capped by resistance. On weakness, we’ll be watching how the euro responds to a drop into support levels.
For a longer-term outlook on EURUSD, check out the just released Q4 Forecast.
EURUSD: Daily

—Written by Paul Robinson, Market Analyst
You can receive Paul’s analysis directly via email bysigning up here.
You can follow Paul on Twitter at@PaulRobinonFX.

Why and how do we use IG Client Sentiment in trading? See our guide and real-time data.
EURUSD: Retail trader data shows 37.3% of traders are net-long with the ratio of traders short to long at 1.68 to 1. In fact, traders have remained net-short since Apr 18 when EURUSD traded near 1.07831; price has moved 9.6% higher since then. The number of traders net-long is 15.4% lower than yesterday and 16.4% higher from last week, while the number of traders net-short is 0.4% higher than yesterday and 10.5% lower from last week.
We typically take a contrarian view to crowd sentiment, and the fact traders are net-short suggests EURUSD prices may continue to rise. Positioning is more net-short than yesterday but less net-short from last week. The combination of current sentiment and recent changes gives us a further mixed EURUSD trading bias.
— Written by Christopher Vecchio, CFA, Senior Currency Strategist
To contact Christopher Vecchio, e-mail cvecchio@dailyfx.com
Follow him on Twitter at @CVecchioFX
To be added to Christopher’s e-mail distribution list, please fill out this form

Why and how do we use IG Client Sentiment in trading? See our guide and real-time data.
GBPUSD: Retail trader data shows 38.2% of traders are net-long with the ratio of traders short to long at 1.62 to 1. In fact, traders have remained net-short since Sep 05 when GBPUSD traded near 1.29615; price has moved 3.4% higher since then. The number of traders net-long is 0.1% higher than yesterday and 13.4% higher from last week, while the number of traders net-short is 10.6% lower than yesterday and 18.3% lower from last week.
We typically take a contrarian view to crowd sentiment, and the fact traders are net-short suggests GBPUSD prices may continue to rise. Yet traders are less net-short than yesterday and compared with last week. Recent changes in sentiment warn that the current GBPUSD price trend may soon reverse lower despite the fact traders remain net-short.
— Written by Christopher Vecchio, CFA, Senior Currency Strategist
To contact Christopher Vecchio, e-mail cvecchio@dailyfx.com
Follow him on Twitter at @CVecchioFX
To be added to Christopher’s e-mail distribution list, please fill out this form
- Brent crude up USD 9/bl on the week… ”deal around the corner” narrative fades
- Market Still Betting on Timely Resolution, But Each Day Raises Shortage Risk
- TACO (or Whatever It Was) Sends Oil Lower — Iran Keeps Choking Hormuz
- Oil stress is rising as the supply chains and buffers are drained
- Buy Brent Dec-2026 calls with strike $150/b!
-
Analys från DailyFX10 år ago
EUR/USD Flirts with Monthly Close Under 30 Year Trendline
-
Marknadsnyheter6 år ago
BrainCool AB (publ): erhåller bidrag (grant) om 0,9 MSEK från Vinnova för bolagets projekt inom behandling av covid-19 patienter med hög feber
-

 Marknadsnyheter3 år ago
Upptäck de bästa verktygen för att analysera Bitcoin!
-
Analys från DailyFX13 år ago
Japanese Yen Breakout or Fakeout? ZAR/JPY May Provide the Answer
-

 Marknadsnyheter3 år ago
Därför föredrar svenska spelare att spela via mobiltelefonen
-
Analys från DailyFX13 år ago
Price & Time: Key Levels to Watch in the Aftermath of NFP
-
Analys från DailyFX9 år ago
Gold Prices Falter at Resistance: Is the Bullish Run Finished?
-
 Nyheter7 år ago
Teknisk analys med Martin Hallström och Nils Brobacke